 AI
AI
 ChatGPT
 Gemini
 Thư viện Prompt
 Công nghệ
 Học IT
 Tiện ích
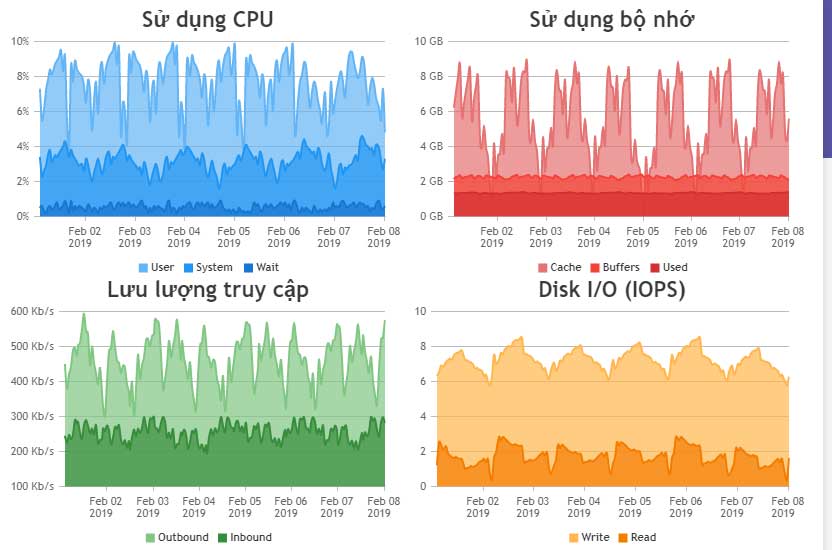
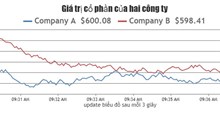
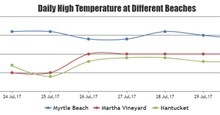
Code mẫu biểu đồ được đồng bộ hóa trong JavaScript

Code mẫu biểu đồ bằng JavaScript dưới đây khá đặc biệt. Tất cả đều được đồng bộ với nhau. Dưới đây là ví dụ code mẫu JavaScript tại biểu đồ kèm ví dụ trực quan.
Dù có thể hiển thị dữ liệu trên nhiều biểu đồ, bạn có thể “hình ảnh hóa” chúng tốt hơn bằng cách dùng Synchronized Charts - Đồng bộ hóa biểu đồ/đồ thị. Dạng biểu đồ này là nơi tooltip, đường chéo & phạm vi trục được đồng bộ trên các biểu đồ. Ví dụ, nếu bạn phóng to, thu nhỏ hoặc xoay bất kỳ một trong số các biểu đồ, nó sẽ tự động zoom/pan các biểu đồ khác. Điều đó cũng diễn ra trên Tooltip & Crosshair.
Dưới đây là ví dụ về code mẫu JavaScript tạo biểu đồ được đồng bộ hóa cùng với mã nguồn mà bạn có thể chạy trên máy tính:
<!DOCTYPE HTML>
<html>
<head>
<script>
window.onload = function () {
  var charts = [];
  var toolTip = {
    shared: true
  },
  legend = {
    cursor: "pointer",
    itemclick: function (e) {
      if (typeof (e.dataSeries.visible) === "undefined" || e.dataSeries.visible) {
        e.dataSeries.visible = false;
      } else {
        e.dataSeries.visible = true;
      }
      e.chart.render();
    }
  };

  var systemDps = [], userDps=[], waitDps = [], buffersDps = [], cacheDps = [], usedDps=[], inboundDps = [], outboundDps = [], writeDps = [], readDps = [];

  var cpuChartOptions = {
    animationEnabled: true,
    theme: "light2", // bạn có thể thay bằng "light1", "light2", "dark1" hoặc "dark2"
    title:{
      text: "Sử dụng CPU"
    },
    toolTip: toolTip,
    axisY: {
      valueFormatString: "#0.#%",
    },
    legend: legend,
    data: [{
      type: "splineArea",
      showInLegend: "true",
      name: "User",
      yValueFormatString: "#0.#%",
      color: "#64b5f6",
      xValueType: "dateTime",
      xValueFormatString: "DD MMM YY HH:mm",
      legendMarkerType: "square",
      dataPoints: userDps
    },{
      type: "splineArea",
      showInLegend: "true",
      name: "System",
      yValueFormatString: "#0.#%",
      color: "#2196f3",
      xValueType: "dateTime",
      xValueFormatString: "DD MMM YY HH:mm",
      legendMarkerType: "square",
      dataPoints: systemDps
    },{
      type: "splineArea",
      showInLegend: "true",
      name: "Wait",
      yValueFormatString: "#0.#%",
      color: "#1976d2",
      xValueType: "dateTime",
      xValueFormatString: "DD MMM YY HH:mm",
      legendMarkerType: "square",
      dataPoints: waitDps
    }]
  };
  var memoryChartOptions = {
    animationEnabled: true,
    theme: "light2",
    title:{
      text: "Sử dụng bộ nhớ"
    },
    axisY: {
      suffix: " GB"
    },
    toolTip: toolTip,
    legend: legend,
    data: [{
      type: "splineArea",
      showInLegend: "true",
      name: "Cache",
      color: "#e57373",
      xValueType: "dateTime",
      xValueFormatString: "DD MMM YY HH:mm",
      yValueFormatString: "#.## GB",
      legendMarkerType: "square",
      dataPoints: cacheDps
    },{
      type: "splineArea",
      showInLegend: "true",
      name: "Buffers",
      color: "#f44336",
      xValueType: "dateTime",
      xValueFormatString: "DD MMM YY HH:mm",
      yValueFormatString: "#.## GB",
      legendMarkerType: "square",
      dataPoints: buffersDps
    },{
      type: "splineArea",
      showInLegend: "true",
      name: "Used",
      color: "#d32f2f",
      xValueType: "dateTime",
      xValueFormatString: "DD MMM YY HH:mm",
      yValueFormatString: "#.## GB",
      legendMarkerType: "square",
      dataPoints: usedDps
    }]
  }
  var networkChartOptions = {
    animationEnabled: true,
    theme: "light2",
    title:{
      text: "Lưu lượng truy cập"
    },
    axisY: {
      suffix: " Kb/s"
    },
    toolTip: toolTip,
    legend: legend,
    data: [{
      type: "splineArea",
      showInLegend: "true",
      name: "Outbound",
      color: "#81c784",
      xValueType: "dateTime",
      xValueFormatString: "DD MMM YY HH:mm",
      yValueFormatString: "#.## Kb/s",
      legendMarkerType: "square",
      dataPoints: outboundDps
    },{
      type: "splineArea",
      showInLegend: "true",
      name: "Inbound",
      color: "#388e3c",
      xValueType: "dateTime",
      xValueFormatString: "DD MMM YY HH:mm",
      yValueFormatString: "#.## Kb/s",
      legendMarkerType: "square",
      dataPoints: inboundDps
    }]
  }
  var diskChartOptions = {
    animationEnabled: true,
    theme: "light2",
    title:{
      text: "Disk I/O (IOPS)"
    },
    axisY: {},
    toolTip: toolTip,
    legend: legend,
    data: [{
      type: "splineArea",
      showInLegend: "true",
      name: "Write",
      color: "#ffb74d",
      xValueType: "dateTime",
      xValueFormatString: "DD MMM YY HH:mm",
      yValueFormatString: "#.## ops/second",
      legendMarkerType: "square",
      dataPoints: writeDps
    },{
      type: "splineArea",
      showInLegend: "true",
      name: "Read",
      color: "#f57c00",
      xValueType: "dateTime",
      xValueFormatString: "DD MMM YY HH:mm",
      yValueFormatString: "#.## ops/second",
      legendMarkerType: "square",
      dataPoints: readDps
    }]
  }

  charts.push(new CanvasJS.Chart("chartContainer1", cpuChartOptions));
  charts.push(new CanvasJS.Chart("chartContainer2", memoryChartOptions));
  charts.push(new CanvasJS.Chart("chartContainer3", networkChartOptions));
  charts.push(new CanvasJS.Chart("chartContainer4", diskChartOptions));

  $.get("https://canvasjs.com/data/gallery/javascript/server-matrics.json", function(data) {
    for (var i = 1; i < data.length; i++) {
      systemDps.push({x: parseInt(data[i].time), y: parseFloat(data[i].system)});
      userDps.push({x: parseInt(data[i].time), y: parseFloat(data[i].user)});
      waitDps.push({x: parseInt(data[i].time), y: parseFloat(data[i].wait)});
      buffersDps.push({x: parseInt(data[i].time), y: parseFloat(data[i].buffers)});
      cacheDps.push({x: parseInt(data[i].time), y: parseFloat(data[i].cache)});
      usedDps.push({x: parseInt(data[i].time), y: parseFloat(data[i].used)});
      inboundDps.push({x: parseInt(data[i].time), y: parseFloat(data[i].inbound)});
      outboundDps.push({x: parseInt(data[i].time), y: parseFloat(data[i].outbound)});
      writeDps.push({x: parseInt(data[i].time), y: parseFloat(data[i].write)});
      readDps.push({x: parseInt(data[i].time), y: parseFloat(data[i].read)});
    }
    for( var i = 0; i < charts.length; i++){
      charts[i].options.axisX = {
        labelAngle: 0,
        crosshair: {
          enabled: true,
          snapToDataPoint: true,
          valueFormatString: "HH:mm"
        }
      }
    }

    syncCharts(charts, true, true, true); // syncCharts(charts, syncToolTip, syncCrosshair, syncAxisXRange)

    for( var i = 0; i < charts.length; i++){
      charts[i].render();
    }

  });

  function syncCharts(charts, syncToolTip, syncCrosshair, syncAxisXRange) {

    if(!this.onToolTipUpdated){
      this.onToolTipUpdated = function(e) {
        for (var j = 0; j < charts.length; j++) {
          if (charts[j] != e.chart)
            charts[j].toolTip.showAtX(e.entries[0].xValue);
        }
      }
    }

    if(!this.onToolTipHidden){
      this.onToolTipHidden = function(e) {
        for( var j = 0; j < charts.length; j++){
          if(charts[j] != e.chart)
            charts[j].toolTip.hide();
        }
      }
    }

    if(!this.onCrosshairUpdated){
      this.onCrosshairUpdated = function(e) {
        for(var j = 0; j < charts.length; j++){
          if(charts[j] != e.chart)
            charts[j].axisX[0].crosshair.showAt(e.value);
        }
      }
    }

    if(!this.onCrosshairHidden){
      this.onCrosshairHidden =  function(e) {
        for( var j = 0; j < charts.length; j++){
          if(charts[j] != e.chart)
            charts[j].axisX[0].crosshair.hide();
        }
      }
    }

    if(!this.onRangeChanged){
      this.onRangeChanged = function(e) {
        for (var j = 0; j < charts.length; j++) {
          if (e.trigger === "reset") {
            charts[j].options.axisX.viewportMinimum = charts[j].options.axisX.viewportMaximum = null;
            charts[j].options.axisY.viewportMinimum = charts[j].options.axisY.viewportMaximum = null;
            charts[j].render();
          } else if (charts[j] !== e.chart) {
            charts[j].options.axisX.viewportMinimum = e.axisX[0].viewportMinimum;
            charts[j].options.axisX.viewportMaximum = e.axisX[0].viewportMaximum;
            charts[j].render();
          }
        }
      }
    }

    for(var i = 0; i < charts.length; i++) {

      //Sync ToolTip
      if(syncToolTip) {
        if(!charts[i].options.toolTip)
          charts[i].options.toolTip = {};

        charts[i].options.toolTip.updated = this.onToolTipUpdated;
        charts[i].options.toolTip.hidden = this.onToolTipHidden;
      }

      //Sync Crosshair
      if(syncCrosshair) {
        if(!charts[i].options.axisX)
          charts[i].options.axisX = { crosshair: { enabled: true }};

        charts[i].options.axisX.crosshair.updated = this.onCrosshairUpdated;
        charts[i].options.axisX.crosshair.hidden = this.onCrosshairHidden;
      }

      //Sync Zoom / Pan
      if(syncAxisXRange) {
        charts[i].options.zoomEnabled = true;
        charts[i].options.rangeChanged = this.onRangeChanged;
      }
    }
  }

}
</script>
<style>
  .row:after {
    content: "";
    display: table;
    clear: both;
  }
  .col {
    float: left;
    width: 50%;
    height: 270px;
  }
</style>
</head>
<body>
<div class="row">
  <div class="col"id="chartContainer1"></div>
  <div class="col" id="chartContainer2"></div>
</div>
<div class="row">
  <div class="col" id="chartContainer3"></div>
  <div class="col" id="chartContainer4"></div>
</div>
<script type="text/javascript" src="https://canvasjs.com/assets/script/jquery-1.11.1.min.js"></script>
<script src="https://canvasjs.com/assets/script/canvasjs.min.js"></script>
</body>
</html>
Nguồn: CanvaJS
Tùy biến biểu đồ
Ví dụ trên đang dùng các sự kiện và phương pháp sau:
- Chart - rangeChanging, rangeChanged
- ToolTip - updated, hidden, showAtX, hide
- Crosshair - updated, hidden, showAt, hide
Bạn nên đọc
-

Code JavaScript tạo biểu đồ/đồ thị đường dạng động
-
JavaScript là gì?
-
Code mẫu JavaScript tạo biểu đồ/đồ thị với Zoom và Pan
-
Code JavaScript tạo mẫu biểu đồ kết hợp OHLC và biểu đồ đường
-
Code mẫu biểu đồ & đồ thị JavaScript với label Index/ Data
-
Code JavaScript tạo biểu đồ/đồ thị động
-
Code JavaScript tạo biểu đồ đa chuỗi update dữ liệu trực tiếp
-
Sự khác biệt giữa JavaScript và Python
-
Code mẫu biểu đồ nhiều chuỗi dữ liệu trong JavaScript


Theo Nghị định 147/2024/ND-CP, bạn cần xác thực tài khoản trước khi sử dụng tính năng này. Chúng tôi sẽ gửi mã xác thực qua SMS hoặc Zalo tới số điện thoại mà bạn nhập dưới đây:
 Hướng dẫn AI
 Ứng dụng
 Hệ thống
 Game - Trò chơi
 iPhone
 Android
 Làng Công nghệ
 Hàm Excel
 Cuộc sống
 Khoa học