 AI
AI
 ChatGPT
 Gemini
 Thư viện Prompt
 Công nghệ
 Học IT
 Tiện ích
Code mẫu JavaScript tạo biểu đồ & đồ thị Drilldown

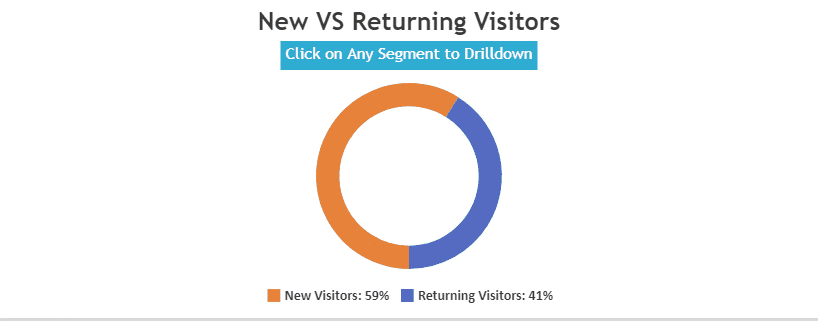
Dưới đây là mẫu biểu đồ Drilldown Chart được tạo bằng JavaScript trong thư viện CanvasJS. Tính năng Drilldown trong Chart được dùng để khám phá dữ liệu sâu hơn, cung cấp thêm các thông tin khác. Tính năng Drilldown có thể dễ dàng được thực hiện trong CanvasJS Library và được hỗ trợ ở tất cả các kiểu biểu đồ bao gồm Bar, Pie, Doughnut, Column, Funnel…
Dưới đây là mẫu biểu đồ Doughnut với tính năng Drilldown bao gồm mã nguồn HTML/JavaScript cho biểu đồ mà bạn có thể chỉnh sửa trong trình duyệt hoặc lưu để chạy nội bộ.
<!DOCTYPE HTML>
<html>
<head>
<script>
window.onload = function () {

var totalVisitors = 883000;
var visitorsData = {
	"New vs Returning Visitors": [{
		click: visitorsChartDrilldownHandler,
		cursor: "pointer",
		explodeOnClick: false,
		innerRadius: "75%",
		legendMarkerType: "square",
		name: "New vs Returning Visitors",
		radius: "100%",
		showInLegend: true,
		startAngle: 90,
		type: "doughnut",
		dataPoints: [
			{ y: 519960, name: "New Visitors", color: "#E7823A" },
			{ y: 363040, name: "Returning Visitors", color: "#546BC1" }
		]
	}],
	"New Visitors": [{
		color: "#E7823A",
		name: "New Visitors",
		type: "column",
		dataPoints: [
			{ x: new Date("1 Jan 2015"), y: 33000 },
			{ x: new Date("1 Feb 2015"), y: 35960 },
			{ x: new Date("1 Mar 2015"), y: 42160 },
			{ x: new Date("1 Apr 2015"), y: 42240 },
			{ x: new Date("1 May 2015"), y: 43200 },
			{ x: new Date("1 Jun 2015"), y: 40600 },
			{ x: new Date("1 Jul 2015"), y: 42560 },
			{ x: new Date("1 Aug 2015"), y: 44280 },
			{ x: new Date("1 Sep 2015"), y: 44800 },
			{ x: new Date("1 Oct 2015"), y: 48720 },
			{ x: new Date("1 Nov 2015"), y: 50840 },
			{ x: new Date("1 Dec 2015"), y: 51600 }
		]
	}],
	"Returning Visitors": [{
		color: "#546BC1",
		name: "Returning Visitors",
		type: "column",
		dataPoints: [
			{ x: new Date("1 Jan 2015"), y: 22000 },
			{ x: new Date("1 Feb 2015"), y: 26040 },
			{ x: new Date("1 Mar 2015"), y: 25840 },
			{ x: new Date("1 Apr 2015"), y: 23760 },
			{ x: new Date("1 May 2015"), y: 28800 },
			{ x: new Date("1 Jun 2015"), y: 29400 },
			{ x: new Date("1 Jul 2015"), y: 33440 },
			{ x: new Date("1 Aug 2015"), y: 37720 },
			{ x: new Date("1 Sep 2015"), y: 35200 },
			{ x: new Date("1 Oct 2015"), y: 35280 },
			{ x: new Date("1 Nov 2015"), y: 31160 },
			{ x: new Date("1 Dec 2015"), y: 34400 }
		]
	}]
};

var newVSReturningVisitorsOptions = {
	animationEnabled: true,
	theme: "light2",
	title: {
		text: "New VS Returning Visitors"
	},
	subtitles: [{
		text: "Click on Any Segment to Drilldown",
		backgroundColor: "#2eacd1",
		fontSize: 16,
		fontColor: "white",
		padding: 5
	}],
	legend: {
		fontFamily: "calibri",
		fontSize: 14,
		itemTextFormatter: function (e) {
			return e.dataPoint.name + ": " + Math.round(e.dataPoint.y / totalVisitors * 100) + "%";
		}
	},
	data: []
};

var visitorsDrilldownedChartOptions = {
	animationEnabled: true,
	theme: "light2",
	axisX: {
		labelFontColor: "#717171",
		lineColor: "#a2a2a2",
		tickColor: "#a2a2a2"
	},
	axisY: {
		gridThickness: 0,
		includeZero: false,
		labelFontColor: "#717171",
		lineColor: "#a2a2a2",
		tickColor: "#a2a2a2",
		lineThickness: 1
	},
	data: []
};

var chart = new CanvasJS.Chart("chartContainer", newVSReturningVisitorsOptions);
chart.options.data = visitorsData["New vs Returning Visitors"];
chart.render();

function visitorsChartDrilldownHandler(e) {
	chart = new CanvasJS.Chart("chartContainer", visitorsDrilldownedChartOptions);
	chart.options.data = visitorsData[e.dataPoint.name];
	chart.options.title = { text: e.dataPoint.name }
	chart.render();
	$("#backButton").toggleClass("invisible");
}

$("#backButton").click(function() {
	$(this).toggleClass("invisible");
	chart = new CanvasJS.Chart("chartContainer", newVSReturningVisitorsOptions);
	chart.options.data = visitorsData["New vs Returning Visitors"];
	chart.render();
});

}
</script>
<style>
  #backButton {
	border-radius: 4px;
	padding: 8px;
	border: none;
	font-size: 16px;
	background-color: #2eacd1;
	color: white;
	position: absolute;
	top: 10px;
	right: 10px;
	cursor: pointer;
  }
  .invisible {
    display: none;
  }
</style>
</head>
<body>

<div id="chartContainer" style="height: 300px; width: 100%;"></div>
<button class="btn invisible" id="backButton">< Back</button>
<script src="https://canvasjs.com/assets/script/jquery-1.11.1.min.js"></script>
<script src="https://canvasjs.com/assets/script/canvasjs.min.js"></script>
</body>
</html>
Nguồn: CanvasJS
Tùy biến biểu đồ
Bạn có thể thay đổi màu của dataSeries bằng thuộc tính color. Radius và innerRadius của biểu đồ Doughnut cũng có thể được tùy biến. Ngoài ra bạn có thể thay đổi cả thuộc tính startAngle, indexLabel…
Bạn nên đọc
-

Cách đưa Bootstrap vào AngularJS bằng ng-bootstrap
-
ReactJS là gì? Nó có thể được sử dụng để làm gì?
-
Top 8 engine JavaScript tốt nhất dành cho nhà phát triển game
-
9 công cụ soạn thảo HTML miễn phí tốt nhất cho Windows 2026
-
Cách cài đặt Reveal.js trên Ubuntu 20.04
-
Cách tính điểm trung bình môn HK 1, HK 2, cả năm
-
Cách khắc phục lỗi Google Chrome bị màn hình đen
-
Cách dùng Driver Talent để cập nhật driver miễn phí
-
Hướng dẫn sửa lỗi “Network path was not found” trong Windows


Theo Nghị định 147/2024/ND-CP, bạn cần xác thực tài khoản trước khi sử dụng tính năng này. Chúng tôi sẽ gửi mã xác thực qua SMS hoặc Zalo tới số điện thoại mà bạn nhập dưới đây:
 Hướng dẫn AI
 Ứng dụng
 Hệ thống
 Game - Trò chơi
 iPhone
 Android
 Làng Công nghệ
 Hàm Excel
 Cuộc sống
 Khoa học