 AI
AI
 ChatGPT
 Gemini
 Thư viện Prompt
 Công nghệ
 Học IT
 Tiện ích
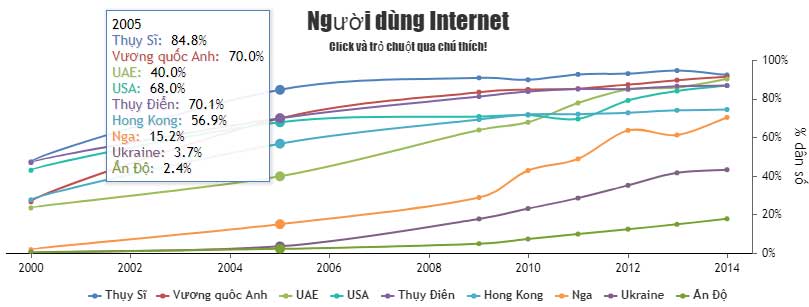
Code mẫu biểu đồ JavaScript có chú thích tùy biến

Chú thích giúp người xem dễ hiểu biểu đồ hơn. Nó mô tả dữ liệu được hiển thị và hỗ trợ mọi kiểu biểu đồ có sẵn trong thư viện - Library. Bạn cũng có thể đính kèm các sự kiện như click, trỏ chuột… cho chú thích.
Ví dụ bên dưới trình bày biểu đồ đường thẳng nhiều chuỗi dữ liệu với các chú thích tùy biến, cho phép bạn click hoặc trỏ chuột qua các chú thích để ẩn/bỏ ẩn hoặc làm nổi bật các chuỗi dữ liệu tương ứng.
Ví dụ này cũng cung cấp mã nguồn hay code JavaScript cho bạn chỉnh sửa hoặc lưu về máy để chạy nội bộ.
<!DOCTYPE HTML>
<html>
<head>
<script>
window.onload = function () {

var chart = new CanvasJS.Chart("chartContainer", {
	//theme: "light2", // "light1", "light2", "dark1", "dark2"
	animationEnabled: true,
	title:{
		text: "Người dùng Internet"
	},
	subtitles: [{
		text: "Click và trỏ chuột qua chú thích!"
	}],
	axisX: {
		lineColor: "black",
		labelFontColor: "black"
	},
	axisY2: {
      	gridThickness: 0,
		title: "% dân số",
		suffix: "%",
		titleFontColor: "black",
		labelFontColor: "black"
	},
	legend: {
		cursor: "pointer",
		itemmouseover: function(e) {
			e.dataSeries.lineThickness = e.chart.data[e.dataSeriesIndex].lineThickness * 2;
			e.dataSeries.markerSize = e.chart.data[e.dataSeriesIndex].markerSize + 2;
			e.chart.render();
		},
		itemmouseout: function(e) {
			e.dataSeries.lineThickness = e.chart.data[e.dataSeriesIndex].lineThickness / 2;
			e.dataSeries.markerSize = e.chart.data[e.dataSeriesIndex].markerSize - 2;
			e.chart.render();
		},
		itemclick: function (e) {
			if (typeof (e.dataSeries.visible) === "undefined" || e.dataSeries.visible) {
				e.dataSeries.visible = false;
			} else {
				e.dataSeries.visible = true;
			}
			e.chart.render();
		}
	},
	toolTip: {
		shared: true
	},
	data: [{
		type: "spline",
		name: "Thụy Sĩ",
		markerSize: 5,
      	axisYType: "secondary",
		xValueFormatString: "YYYY",
		yValueFormatString: "#,##0.0\"%\"",
		showInLegend: true,
		dataPoints: [
			{ x: new Date(2000, 00), y: 47.5 },
			{ x: new Date(2005, 00), y: 84.8 },
			{ x: new Date(2009, 00), y: 91 },
			{ x: new Date(2010, 00), y: 90 },
			{ x: new Date(2011, 00), y: 92.8 },
			{ x: new Date(2012, 00), y: 93.2 },
			{ x: new Date(2013, 00), y: 94.8 },
			{ x: new Date(2014, 00), y: 92.5 }
		]
	},
	{
		type: "spline",
		name: "Vương quốc Anh",
		markerSize: 5,
		axisYType: "secondary",
		xValueFormatString: "YYYY",
		yValueFormatString: "#,##0.0\"%\"",
		showInLegend: true,
		dataPoints: [
			{ x: new Date(2000, 00), y: 26.8 },
			{ x: new Date(2005, 00), y: 70 },
			{ x: new Date(2009, 00), y: 83.6 },
			{ x: new Date(2010, 00), y: 85 },
			{ x: new Date(2011, 00), y: 85.4 },
			{ x: new Date(2012, 00), y: 87.5 },
			{ x: new Date(2013, 00), y: 89.8 },
			{ x: new Date(2014, 00), y: 91.6 }
		]
	},
	{
		type: "spline",
		name: "UAE",
		markerSize: 5,
		axisYType: "secondary",
		xValueFormatString: "YYYY",
		yValueFormatString: "#,##0.0\"%\"",
		showInLegend: true,
		dataPoints: [
			{ x: new Date(2000, 00), y: 23.6 },
			{ x: new Date(2005, 00), y: 40 },
			{ x: new Date(2009, 00), y: 64 },
			{ x: new Date(2010, 00), y: 68 },
			{ x: new Date(2011, 00), y: 78 },
			{ x: new Date(2012, 00), y: 85 },
			{ x: new Date(2013, 00), y: 86 },
			{ x: new Date(2014, 00), y: 90.4 }
		]
	},
	{
		type: "spline",
		showInLegend: true,
		name: "USA",
		markerSize: 5,
		axisYType: "secondary",
		yValueFormatString: "#,##0.0\"%\"",
		xValueFormatString: "YYYY",
		dataPoints: [
			{ x: new Date(2000, 00), y: 43.1 },
			{ x: new Date(2005, 00), y: 68 },
			{ x: new Date(2009, 00), y: 71 },
			{ x: new Date(2010, 00), y: 71.7 },
			{ x: new Date(2011, 00), y: 69.7 },
			{ x: new Date(2012, 00), y: 79.3 },
			{ x: new Date(2013, 00), y: 84.2 },
			{ x: new Date(2014, 00), y: 87 }
		]
	},
	{
		type: "spline",
		name: "Thụy Điển",
		markerSize: 5,
		axisYType: "secondary",
		xValueFormatString: "YYYY",
		yValueFormatString: "#,##0.0\"%\"",
		showInLegend: true,
		dataPoints: [
			{ x: new Date(2000, 00), y: 47.1 },
			{ x: new Date(2005, 00), y: 70.1 },
			{ x: new Date(2009, 00), y: 81.3 },
			{ x: new Date(2010, 00), y: 83.9 },
			{ x: new Date(2011, 00), y: 85.2 },
			{ x: new Date(2012, 00), y: 85.2 },
			{ x: new Date(2013, 00), y: 86.7 },
			{ x: new Date(2014, 00), y: 87 }
		]
	},
	{
		type: "spline",
		name: "Hong Kong",
		markerSize: 5,
		axisYType: "secondary",
		xValueFormatString: "YYYY",
		yValueFormatString: "#,##0.0\"%\"",
		showInLegend: true,
		dataPoints: [
			{ x: new Date(2000, 00), y: 27.8 },
			{ x: new Date(2005, 00), y: 56.9 },
			{ x: new Date(2009, 00), y: 69.4 },
			{ x: new Date(2010, 00), y: 72 },
			{ x: new Date(2011, 00), y: 72.2 },
			{ x: new Date(2012, 00), y: 72.9 },
			{ x: new Date(2013, 00), y: 74.2 },
			{ x: new Date(2014, 00), y: 74.6 }
		]
	},
	{
		type: "spline",
		name: "Nga",
		markerSize: 5,
		axisYType: "secondary",
		xValueFormatString: "YYYY",
		yValueFormatString: "#,##0.0\"%\"",
		showInLegend: true,
		dataPoints: [
			{ x: new Date(2000, 00), y: 2 },
			{ x: new Date(2005, 00), y: 15.2 },
			{ x: new Date(2009, 00), y: 29 },
			{ x: new Date(2010, 00), y: 43 },
			{ x: new Date(2011, 00), y: 49 },
			{ x: new Date(2012, 00), y: 63.8 },
			{ x: new Date(2013, 00), y: 61.4 },
			{ x: new Date(2014, 00), y: 70.5 }
		]
	},
	{
		type: "spline",
		name: "Ukraine",
		markerSize: 5,
		axisYType: "secondary",
		xValueFormatString: "YYYY",
		yValueFormatString: "#,##0.0\"%\"",
		showInLegend: true,
		dataPoints: [
			{ x: new Date(2000, 00), y: .7 },
			{ x: new Date(2005, 00), y: 3.7 },
			{ x: new Date(2009, 00), y: 17.9 },
			{ x: new Date(2010, 00), y: 23.3 },
			{ x: new Date(2011, 00), y: 28.7 },
			{ x: new Date(2012, 00), y: 35.3 },
			{ x: new Date(2013, 00), y: 41.8 },
			{ x: new Date(2014, 00), y: 43.4 }
		]
	},
	{
		type: "spline",
		name: "Ấn Độ",
		markerSize: 5,
		axisYType: "secondary",
		xValueFormatString: "YYYY",
		yValueFormatString: "#,##0.0\"%\"",
		showInLegend: true,
		dataPoints: [
			{ x: new Date(2000, 00), y: .5 },
			{ x: new Date(2005, 00), y: 2.4 },
			{ x: new Date(2009, 00), y: 5.1 },
			{ x: new Date(2010, 00), y: 7.5 },
			{ x: new Date(2011, 00), y: 10.1 },
			{ x: new Date(2012, 00), y: 12.6 },
			{ x: new Date(2013, 00), y: 15.1 },
			{ x: new Date(2014, 00), y: 18 }
		]
	}]
});
chart.render();

}
</script>
</head>
<body>
<div id="chartContainer" style="height: 300px; width: 100%;"></div>
<script src="https://canvasjs.com/assets/script/canvasjs.min.js"></script>
</body>
</html>
Nguồn: CanvasJS
Tùy biến biểu đồ
Bạn có thể đính kèm các sự kiện vào chú thích bằng itemmouseover, itemmousemove, itemmouseout hoặc itemclick. Bạn cũng có thể thay đổi vị trí của các chú thích bằng horizontalAlign và vertialAlign.
Một số tùy biến khác bao gồm dockInsidePlotArea, legendMarkerColor…
Bạn nên đọc
-

JavaScript là gì?
-
Code mẫu JavaScript tạo biểu đồ với số lượng lớn điểm dữ liệu
-
Code JavaScript tạo mẫu biểu đồ kết hợp OHLC và biểu đồ đường
-
Tổng hợp bài tập JavaScript có code mẫu
-
Code JavaScript tạo biểu đồ/đồ thị đường dạng động
-
Code JavaScript tạo mẫu biểu đồ với crosshair
-
Code JavaScript tạo mẫu biểu đồ thay đổi dữ liệu tại thời gian thực
-
Code JavaScript tạo biểu đồ đa chuỗi update dữ liệu trực tiếp
-
Code mẫu JavaScript tạo biểu đồ với các điểm dữ liệu có thể kéo


Theo Nghị định 147/2024/ND-CP, bạn cần xác thực tài khoản trước khi sử dụng tính năng này. Chúng tôi sẽ gửi mã xác thực qua SMS hoặc Zalo tới số điện thoại mà bạn nhập dưới đây:
 Hướng dẫn AI
 Ứng dụng
 Hệ thống
 Game - Trò chơi
 iPhone
 Android
 Làng Công nghệ
 Hàm Excel
 Cuộc sống
 Khoa học