 AI
AI
 ChatGPT
 Gemini
 Thư viện Prompt
 Công nghệ
 Học IT
 Tiện ích
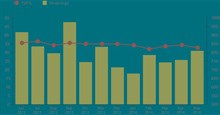
Code mẫu JavaScript tạo biểu đồ với các điểm dữ liệu có thể kéo

Biểu đồ JavaScript này chứa các điểm dữ liệu có thể kéo bằng chuột để cập nhật giá trị của nó. Tính năng này hữu ích trong việc xây dựng ứng dụng cho phép người dùng thay đổi giá trị trực tiếp để thấy tác động của nó trên các tham số khác.
Thư viện này cung cấp một số phương pháp để lấy và thiết lập giá trị cho các thuộc tính khác. Ví dụ đưa ra dùng phương pháp convertPixelToValue mà chuyển đổi tọa độ pixel thành giá trị trục. Nó cũng bao gồm mã nguồn mà bạn có thể chỉnh sửa trong trình duyệt hoặc lưu để chạy nội bộ.

<!DOCTYPE html>
<html>
<head>
<script>
window.onload = function() {

var chart = new CanvasJS.Chart("chartContainer", {
	animationEnabled: true,
	title: {
		text: "Kéo cột bất kỳ để chỉnh lại kích thước"
	},
	axisX:{
		minimum: 5,
		maximum: 95
	},
	data: [{
		type: "column",
		dataPoints: [
			{ x: 10, y: 71 },
			{ x: 20, y: 55 },
			{ x: 30, y: 50 },
			{ x: 40, y: 65 },
			{ x: 50, y: 95 },
			{ x: 60, y: 68 },
			{ x: 70, y: 28 },
			{ x: 80, y: 34 },
			{ x: 90, y: 14 }
		]
	}]
});
chart.render();

var xSnapDistance = chart.axisX[0].convertPixelToValue(chart.get("dataPointWidth")) / 2;
var ySnapDistance = 3;

var xValue, yValue;

var mouseDown = false;
var selected = null;
var changeCursor = false;

var timerId = null;

function getPosition(e) {
	var parentOffset = $("#chartContainer > .canvasjs-chart-container").offset();
	var relX = e.pageX - parentOffset.left;
	var relY = e.pageY - parentOffset.top;
	xValue = Math.round(chart.axisX[0].convertPixelToValue(relX));
	yValue = Math.round(chart.axisY[0].convertPixelToValue(relY));
}

function searchDataPoint() {
	var dps = chart.data[0].dataPoints;
	for(var i = 0; i < dps.length; i++ ) {
		if( (xValue >= dps[i].x - xSnapDistance && xValue <= dps[i].x + xSnapDistance) && (yValue >= dps[i].y - ySnapDistance && yValue <= dps[i].y + ySnapDistance) )
		{
			if(mouseDown) {
				selected = i;
				break;
			} else {
				changeCursor = true;
				break;
			}
		} else {
			selected = null;
			changeCursor = false;
		}
	}
}

jQuery("#chartContainer > .canvasjs-chart-container").on({
	mousedown: function(e) {
		mouseDown = true;
		getPosition(e);
		searchDataPoint();
	},
	mousemove: function(e) {
		getPosition(e);
		if(mouseDown) {
			clearTimeout(timerId);
			timerId = setTimeout(function(){
				if(selected != null) {
					chart.data[0].dataPoints[selected].y = yValue;
					chart.render();
				}
			}, 0);
		}
		else {
			searchDataPoint();
			if(changeCursor) {
				chart.data[0].set("cursor", "n-resize");
			} else {
				chart.data[0].set("cursor", "default");
			}
		}
	},
	mouseup: function(e) {
		if(selected != null) {
			chart.data[0].dataPoints[selected].y = yValue;
			chart.render();
			mouseDown = false;
		}
	}
});

}
</script>
</head>
<body>
<div id="chartContainer" style="height: 300px; width: 100%;"></div>
<script src="https://canvasjs.com/assets/script/canvasjs.min.js"></script>
<script src="https://code.jquery.com/jquery-3.1.1.min.js"></script>
</body>
</html>
Nguồn: CanvasJS
Tùy biến biểu đồ
Bạn có thể tìm nạp hoặc cập nhật các giá trị khác nhau trong biểu đồ bằng phương thức “get” và “set” tương ứng. Bạn cũng có thể thay đổi chiều rộng của cột bằng dataPointWidth.
Bạn nên đọc
-

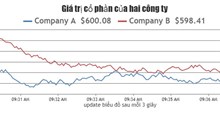
Code JavaScript tạo biểu đồ đa chuỗi update dữ liệu trực tiếp
-
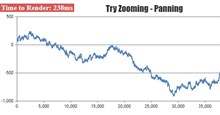
Code mẫu JavaScript tạo biểu đồ với số lượng lớn điểm dữ liệu
-
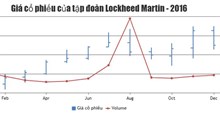
Code mẫu JavaScript tạo biểu đồ với trục thứ hai
-
Code JavaScript tạo mẫu biểu đồ kết hợp OHLC và biểu đồ đường
-
Code JavaScript tạo biểu đồ/đồ thị đường dạng động
-
Code JavaScript tạo mẫu biểu đồ thay đổi dữ liệu tại thời gian thực
-
JavaScript là gì?
-
Code JavaScript tạo biểu đồ/đồ thị động
-
Tổng hợp bài tập JavaScript có code mẫu


Theo Nghị định 147/2024/ND-CP, bạn cần xác thực tài khoản trước khi sử dụng tính năng này. Chúng tôi sẽ gửi mã xác thực qua SMS hoặc Zalo tới số điện thoại mà bạn nhập dưới đây:
 Hướng dẫn AI
 Ứng dụng
 Hệ thống
 Game - Trò chơi
 iPhone
 Android
 Làng Công nghệ
 Hàm Excel
 Cuộc sống
 Khoa học