 AI
AI
 ChatGPT
 Gemini
 Thư viện Prompt
 Công nghệ
 Học IT
 Tiện ích
Code JavaScript tạo biểu đồ đa chuỗi update dữ liệu trực tiếp

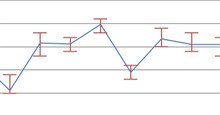
Biểu đồ động cũng có dạng đa chuỗi dữ liệu. Những biểu đồ này đều có tính tương tác, phản hồi, hỗ trợ hoạt ảnh, sự kiện và update ngay tại thời gian thực.
Ví dụ bên dưới minh họa mẫu biểu đồ đường đa chuỗi được update dữ liệu sau mỗi 3 giây. Nó được tạo bằng JavaScript. Bài viết cũng cung cấp mã nguồn cho bạn chỉnh sửa trong trình duyệt hoặc lưu về máy để chạy nội bộ.
<!DOCTYPE HTML>
<html>
<head>
<script>
window.onload = function () {

var dataPoints1 = [];
var dataPoints2 = [];

var chart = new CanvasJS.Chart("chartContainer", {
	zoomEnabled: true,
	title: {
		text: "Giá trị cổ phần của hai công ty"
	},
	axisX: {
		title: "update biểu đồ sau mỗi 3 giây"
	},
	axisY:{
		prefix: "$"
	},
	toolTip: {
		shared: true
	},
	legend: {
		cursor:"pointer",
		verticalAlign: "top",
		fontSize: 22,
		fontColor: "dimGrey",
		itemclick : toggleDataSeries
	},
	data: [{
		type: "line",
		xValueType: "dateTime",
		yValueFormatString: "$####.00",
		xValueFormatString: "hh:mm:ss TT",
		showInLegend: true,
		name: "Công ty A",
		dataPoints: dataPoints1
		},
		{
			type: "line",
			xValueType: "dateTime",
			yValueFormatString: "$####.00",
			showInLegend: true,
			name: "Công ty B" ,
			dataPoints: dataPoints2
	}]
});

function toggleDataSeries(e) {
	if (typeof(e.dataSeries.visible) === "undefined" || e.dataSeries.visible) {
		e.dataSeries.visible = false;
	}
	else {
		e.dataSeries.visible = true;
	}
	chart.render();
}

var updateInterval = 3000;
// initial value
var yValue1 = 600;
var yValue2 = 605;

var time = new Date;
// Bắt đầu ở 9.30 sáng
time.setHours(9);
time.setMinutes(30);
time.setSeconds(00);
time.setMilliseconds(00);

function updateChart(count) {
	count = count || 1;
	var deltaY1, deltaY2;
	for (var i = 0; i < count; i++) {
		time.setTime(time.getTime()+ updateInterval);
		deltaY1 = .5 + Math.random() *(-.5-.5);
		deltaY2 = .5 + Math.random() *(-.5-.5);

	// thêm giá trị ngẫu nhiên và làm tròn nó sang số có 2 chữ số.
	yValue1 = Math.round((yValue1 + deltaY1)*100)/100;
	yValue2 = Math.round((yValue2 + deltaY2)*100)/100;

	// đẩy giá trị mới.
	dataPoints1.push({
		x: time.getTime(),
		y: yValue1
	});
	dataPoints2.push({
		x: time.getTime(),
		y: yValue2
	});
	}

	// update nội dung chú giải bằng cách cập nhật giá trị y.
	chart.options.data[0].legendText = " Company A  $" + yValue1;
	chart.options.data[1].legendText = " Company B  $" + yValue2;
	chart.render();
}
// Tạo nhóm dataPoint đầu tiên.
updateChart(100);
setInterval(function(){updateChart()}, updateInterval);

}
</script>
</head>
<body>
<div id="chartContainer" style="height: 300px; width: 100%;"></div>
<script src="https://cdn.canvasjs.com/canvasjs.min.js"></script>
</body>
</html>Nguồn: CanvasJS
Tùy biến biểu đồ
Bạn có thể ẩn/bỏ ẩn một chuỗi dữ liệu bằng thuộc tính visible. Sự kiện từ các mục chú giải như itemclick thường được dùng để bật hiển thị chuỗi dữ liệu. Những lựa chọn phổ biến khác bao gồm: lineThicnkess (độ dày đường thẳng), markerType (kiểu đánh dấu), lineColor (màu đường thẳng)…
Bạn nên đọc
-

Code JavaScript tạo biểu đồ/đồ thị kết hợp đường, vùng và cột
-
Code JavaScript tạo biểu đồ box và whisker chứa điểm ngoại lai
-
Code JavaScript tạo biểu đồ/đồ thị box và whisker
-
Code JavaScript tạo biểu đồ & đồ thị sai số
-
Code biểu đồ/đồ thị thanh kết hợp sai số
-
Code JavaScript tạo biểu đồ/đồ thị đường sai số
-
Tổng hợp bài tập JavaScript có code mẫu
-
Code JavaScript tạo biểu đồ kết hợp giữa vùng và đường
-
Code JavaScript tạo biểu đồ & đồ thị Pareto


Theo Nghị định 147/2024/ND-CP, bạn cần xác thực tài khoản trước khi sử dụng tính năng này. Chúng tôi sẽ gửi mã xác thực qua SMS hoặc Zalo tới số điện thoại mà bạn nhập dưới đây:
 Hướng dẫn AI
 Ứng dụng
 Hệ thống
 Game - Trò chơi
 iPhone
 Android
 Làng Công nghệ
 Hàm Excel
 Cuộc sống
 Khoa học