 AI
AI
 ChatGPT
 Gemini
 Thư viện Prompt
 Công nghệ
 Học IT
 Tiện ích
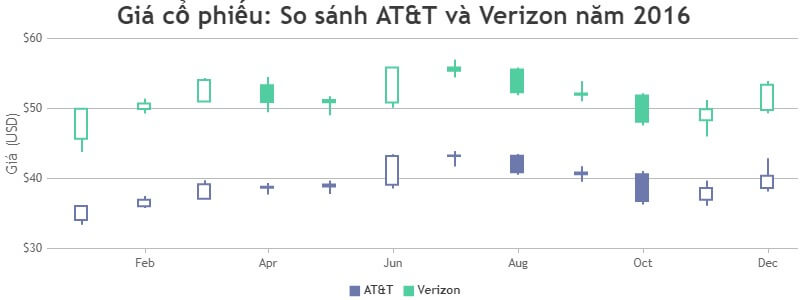
Code JavaScript tạo biểu đồ dạng nến đa chuỗi dữ liệu

Biểu đồ hình nến đa chuỗi dữ liệu hữu ích khi bạn phải so sánh từ hai tập dữ liệu trở lên. Từng điểm dữ liệu bên trong đại diện cho các giá trị mở, cao, thấp và kín. Biểu đồ cây nến chủ yếu được dùng để trình bày giá cổ phiếu, ngoại hối, hàng hóa…
Ví dụ bên dưới minh họa một mẫu biểu đồ nến so sánh giá cổ phiếu của AT&T với Verizon vào năm 2016 được tạo bằng JavaScript. Bài viết cũng cung cấp mã nguồn cho bạn chỉnh sửa trong trình duyệt và lưu về máy để chạy nội bộ.
<!DOCTYPE HTML>
<html>
<head>
<script>
window.onload = function () {

var chart = new CanvasJS.Chart("chartContainer", {
	animationEnabled: true,
	theme: "light2", // bạn có thể thay bằng "light1", "light2", "dark1", "dark2"
	exportEnabled: true,
	title:{
		text: "Giá cổ phiếu: So sánh AT&T và Verizon năm 2016"
	},
	axisX: {
		valueFormatString: "MMM"
	},
	axisY: {
		prefix: "$",
		title: "Giá (USD)"
	},
	toolTip: {
		shared: true
	},
	legend: {
		cursor: "pointer",
		itemclick: toogleDataSeries
	},
	data: [{
		type: "candlestick",
		showInLegend: true,
		name: "AT&T",
		yValueFormatString: "$###0.00",
		xValueFormatString: "MMMM YY",
		dataPoints: [
			{ x: new Date(2016, 00, 01), y: [34.080002, 36.060001, 33.410000, 36.060001] },
			{ x: new Date(2016, 01, 01), y: [36.040001, 37.500000, 35.790001, 36.950001] },
			{ x: new Date(2016, 02, 01), y: [37.099998, 39.720001, 37.060001, 39.169998] },
			{ x: new Date(2016, 03, 01), y: [38.669998, 39.360001, 37.730000, 38.820000] },
			{ x: new Date(2016, 04, 01), y: [38.869999, 39.669998, 37.770000, 39.150002] },
			{ x: new Date(2016, 05, 01), y: [39.099998, 43.419998, 38.580002, 43.209999] },
			{ x: new Date(2016, 06, 01), y: [43.209999, 43.889999, 41.700001, 43.290001] },
			{ x: new Date(2016, 07, 01), y: [43.250000, 43.500000, 40.549999, 40.880001] },
			{ x: new Date(2016, 08, 01), y: [40.849998, 41.700001, 39.549999, 40.610001] },
			{ x: new Date(2016, 09, 01), y: [40.619999, 41.040001, 36.270000, 36.790001] },
			{ x: new Date(2016, 10, 01), y: [36.970001, 39.669998, 36.099998, 38.630001] },
			{ x: new Date(2016, 11, 01), y: [38.630001, 42.840000, 38.160000, 40.380001] }
		]
	},
	{
		type: "candlestick",
		showInLegend: true,
		name: "Verizon",
		yValueFormatString: "$###0.00",
		dataPoints: [
			{ x: new Date(2016, 00, 01), y: [45.669998, 49.990002, 43.790001, 49.970001] },
			{ x: new Date(2016, 01, 01), y: [49.939999, 51.380001, 49.270000, 50.730000] },
			{ x: new Date(2016, 02, 01), y: [50.990002, 54.369999, 50.980000, 54.080002] },
			{ x: new Date(2016, 03, 01), y: [53.320000, 54.490002, 49.470001, 50.939999] },
			{ x: new Date(2016, 04, 01), y: [51.220001, 51.700001, 49.049999, 50.900002] },
			{ x: new Date(2016, 05, 01), y: [50.869999, 55.919998, 50.119999, 55.840000] },
			{ x: new Date(2016, 06, 01), y: [55.849998, 56.950001, 54.439999, 55.410000] },
			{ x: new Date(2016, 07, 01), y: [55.580002, 55.820000, 51.900002, 52.330002] },
			{ x: new Date(2016, 08, 01), y: [52.139999, 53.880001, 51.020000, 51.980000] },
			{ x: new Date(2016, 09, 01), y: [51.840000, 52.139999, 47.580002, 48.099998] },
			{ x: new Date(2016, 10, 01), y: [48.320000, 51.200001, 46.009998, 49.900002] },
			{ x: new Date(2016, 11, 01), y: [49.799999, 53.900002, 49.310001, 53.380001] }
		]
	}]
});
chart.render();

function toogleDataSeries(e) {
	if (typeof (e.dataSeries.visible) === "undefined" || e.dataSeries.visible) {
		e.dataSeries.visible = false;
	} else {
		e.dataSeries.visible = true;
	}
	e.chart.render();
}

}
</script>
</head>
<body>
<div id="chartContainer" style="height: 300px; width: 100%;"></div>
<script type="text/javascript" src="https://canvasjs.com/assets/script/canvasjs.min.js"></script>
</body>
</html>
Nguồn: CanvasJS
Tùy chỉnh biểu đồ
Bạn có thể hiện chú giải bằng cách đặt showInLegend sang true. Tính năng này thật sự hữu ích, giúp dữ liệu trên biểu đồ dễ đọc hơn. Những lựa chọn tùy biến liên quan khác bao gồm exportEnabled, animationEnabled…
Bạn nên đọc
-

Code JavaScript tạo biểu đồ hình phễu có thể tùy chỉnh kích thước
-
Code JavaScript tạo mẫu biểu đồ kết hợp OHLC và biểu đồ đường
-
Tổng hợp bài tập JavaScript có code mẫu
-
Code JavaScript tạo biểu đồ đa chuỗi update dữ liệu trực tiếp
-
Code JavaScript tạo biểu đồ hình tròn với bán kính tùy chỉnh
-
Code JavaScript tạo biểu đồ/đồ thị hình tròn
-
Code JavaScript tạo biểu đồ/đồ thị động
-
Code JavaScript tạo biểu đồ dạng phễu đảo ngược
-
Code mẫu JavaScript tạo biểu đồ kim tự tháp với các nhãn chỉ mục/dữ liệu


Theo Nghị định 147/2024/ND-CP, bạn cần xác thực tài khoản trước khi sử dụng tính năng này. Chúng tôi sẽ gửi mã xác thực qua SMS hoặc Zalo tới số điện thoại mà bạn nhập dưới đây:
 Hướng dẫn AI
 Ứng dụng
 Hệ thống
 Game - Trò chơi
 iPhone
 Android
 Làng Công nghệ
 Hàm Excel
 Cuộc sống
 Khoa học