 AI
AI
 ChatGPT
 Gemini
 Thư viện Prompt
 Công nghệ
 Học IT
 Tiện ích
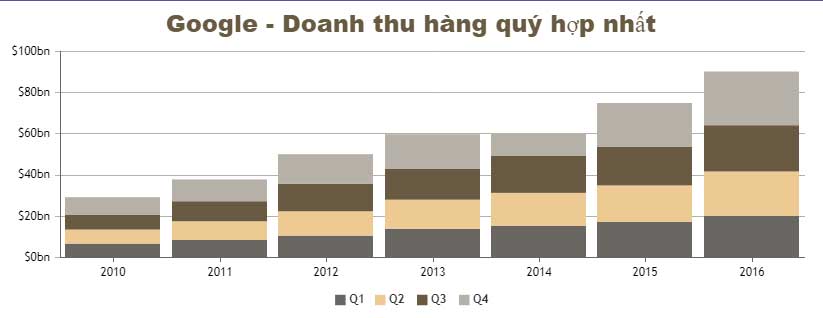
Code JavaScript tạo biểu đồ/đồ thị cột dạng xếp chồng

Biểu đồ cột dạng xếp chồng còn được gọi là biểu đồ thanh xếp chồng. Đúng như tên gọi, biểu đồ này được tạo thành bằng cách xếp chồng nhiều cột/thanh dữ liệu. Chúng cho bạn thấy mối quan hệ giữa từng giá trị với tổng số. Biểu đồ có tính tương tác, hỗ trợ hiệu ứng động, thu phóng, xoay & xuất dưới dạng ảnh.
Ví dụ bên dưới minh họa một mẫu biểu đồ cột xếp chồng được tạo bằng JavaScript kèm code nguồn HTML cho bạn chỉnh sửa trong trình duyệt hoặc lưu về máy để chạy nội bộ.
<!DOCTYPE HTML>
<html>
<head>
<script>
window.onload = function () {

var chart = new CanvasJS.Chart("chartContainer", {
	animationEnabled: true,
	title:{
		text: "Google - Doanh thu hàng quý hợp nhất",
		fontFamily: "arial black",
		fontColor: "#695A42"
	},
	axisX: {
		interval: 1,
		intervalType: "year"
	},
	axisY:{
		valueFormatString:"$#0bn",
		gridColor: "#B6B1A8",
		tickColor: "#B6B1A8"
	},
	toolTip: {
		shared: true,
		content: toolTipContent
	},
	data: [{
		type: "stackedColumn",
		showInLegend: true,
		color: "#696661",
		name: "Q1",
		dataPoints: [
			{ y: 6.75, x: new Date(2010,0) },
			{ y: 8.57, x: new Date(2011,0) },
			{ y: 10.64, x: new Date(2012,0) },
			{ y: 13.97, x: new Date(2013,0) },
			{ y: 15.42, x: new Date(2014,0) },
			{ y: 17.26, x: new Date(2015,0) },
			{ y: 20.26, x: new Date(2016,0) }
		]
		},
		{
			type: "stackedColumn",
			showInLegend: true,
			name: "Q2",
			color: "#EDCA93",
			dataPoints: [
				{ y: 6.82, x: new Date(2010,0) },
				{ y: 9.02, x: new Date(2011,0) },
				{ y: 11.80, x: new Date(2012,0) },
				{ y: 14.11, x: new Date(2013,0) },
				{ y: 15.96, x: new Date(2014,0) },
				{ y: 17.73, x: new Date(2015,0) },
				{ y: 21.5, x: new Date(2016,0) }
			]
		},
		{
			type: "stackedColumn",
			showInLegend: true,
			name: "Q3",
			color: "#695A42",
			dataPoints: [
				{ y: 7.28, x: new Date(2010,0) },
				{ y: 9.72, x: new Date(2011,0) },
				{ y: 13.30, x: new Date(2012,0) },
				{ y: 14.9, x: new Date(2013,0) },
				{ y: 18.10, x: new Date(2014,0) },
				{ y: 18.68, x: new Date(2015,0) },
				{ y: 22.45, x: new Date(2016,0) }
			]
		},
		{
			type: "stackedColumn",
			showInLegend: true,
			name: "Q4",
			color: "#B6B1A8",
			dataPoints: [
				{ y: 8.44, x: new Date(2010,0) },
				{ y: 10.58, x: new Date(2011,0) },
				{ y: 14.41, x: new Date(2012,0) },
				{ y: 16.86, x: new Date(2013,0) },
				{ y: 10.64, x: new Date(2014,0) },
				{ y: 21.32, x: new Date(2015,0) },
				{ y: 26.06, x: new Date(2016,0) }
			]
	}]
});
chart.render();

function toolTipContent(e) {
	var str = "";
	var total = 0;
	var str2, str3;
	for (var i = 0; i < e.entries.length; i++){
		var  str1 = "<span style= \"color:"+e.entries[i].dataSeries.color + "\"> "+e.entries[i].dataSeries.name+"</span>: $<strong>"+e.entries[i].dataPoint.y+"</strong>bn<br/>";
		total = e.entries[i].dataPoint.y + total;
		str = str.concat(str1);
	}
	str2 = "<span style = \"color:DodgerBlue;\"><strong>"+(e.entries[0].dataPoint.x).getFullYear()+"</strong></span><br/>";
	total = Math.round(total * 100) / 100;
	str3 = "<span style = \"color:Tomato\">Total:</span><strong> $"+total+"</strong>bn<br/>";
	return (str2.concat(str)).concat(str3);
}

}
</script>
</head>
<body>
<div id="chartContainer" style="height: 300px; width: 100%;"></div>
<script src="https://canvasjs.com/assets/script/canvasjs.min.js"></script>
</body>
</html>
Tùy biến biểu đồ
Bạn có thể hiện chú giải bằng cách đặt showInLegend sang true. Chú giải sẽ giúp người xem dễ đọc dữ liệu trên bản đồ hơn. Một số lựa chọn tùy chỉnh khác bao gồm:
Color- Màu sắcdataPointWidth- Độ rộng điểm dữ liệu- ...
Bạn nên đọc
-

Code JavaScript tạo biểu đồ thanh có ngắt trục tọa độ
-
Code mẫu JavaScript tạo biểu đồ cột nhiều chuỗi dữ liệu
-
Code JavaScript tạo biểu đồ thanh đa chuỗi dữ liệu
-
Tổng hợp bài tập JavaScript có code mẫu
-
Code JavaScript tạo biểu đồ/đồ thị động
-
Code JavaScript tạo biểu đồ & đồ thị thanh
-
Code JavaScript tạo biểu đồ/đồ thị cột theo phạm vi
-
Code JavaScript tạo mẫu biểu đồ kết hợp OHLC và biểu đồ đường
-
JavaScript là gì?


Theo Nghị định 147/2024/ND-CP, bạn cần xác thực tài khoản trước khi sử dụng tính năng này. Chúng tôi sẽ gửi mã xác thực qua SMS hoặc Zalo tới số điện thoại mà bạn nhập dưới đây:
 Hướng dẫn AI
 Ứng dụng
 Hệ thống
 Game - Trò chơi
 iPhone
 Android
 Làng Công nghệ
 Hàm Excel
 Cuộc sống
 Khoa học