 AI
AI
 ChatGPT
 Gemini
 Thư viện Prompt
 Công nghệ
 Học IT
 Tiện ích
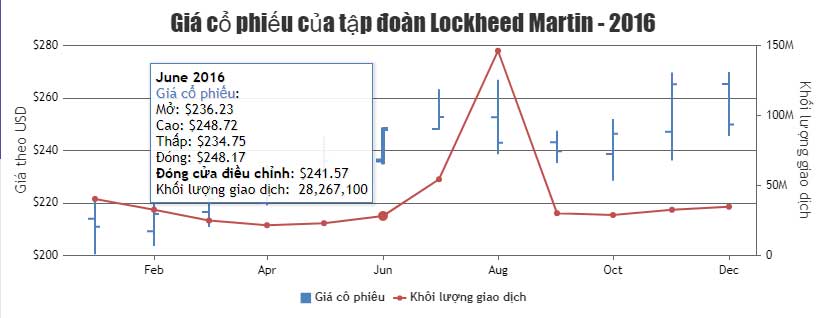
Code JavaScript tạo mẫu biểu đồ kết hợp OHLC và biểu đồ đường

Bạn cũng có thể kết hợp biểu đồ đường với OHLC. Biểu đồ/đồ thị đường trong OHLC được dùng để hiện các tham số khác nhau trong phân tích tài chính. Bạn cũng có thể kết hợp đồ thị OHLC với biểu đồ spline hoặc vùng.
Ví dụ bên dưới minh họa một mẫu biểu đồ giá cổ phiếu của Lockheed Martin năm 2016 cùng với số lượng cổ phần bằng cách kết hợp đồ thị OHLC và đường. Nó được tạo bằng JavaScript và bạn sẽ thấy mã nguồn ở bên dưới ảnh minh họa.
<!DOCTYPE HTML>
<html>
<head>
<script>
window.onload = function () {

var chart = new CanvasJS.Chart("chartContainer", {
	animationEnabled: true,
	title: {
		text: "Giá cổ phiếu của tập đoàn Lockheed Martin - 2016"
	},
	axisX: {
		valueFormatString: "MMM"
	},
	axisY: {
		title: "Giá theo USD",
		prefix: "$",
		lineThickness: 0
	},
	axisY2: {
		title: "Khối lượng giao dịch",
		labelFormatter: addSymbols
	},
	toolTip: {
		shared: true
	},
	legend: {
		cursor: "pointer",
		itemclick: toggleDataSeries
	},
	data: [{
		type: "ohlc",
		xValueFormatString: "MMMM 2016",
		name: "Giá cổ phiếu",
		showInLegend: true,
		yValueFormatString: "$###0.00",
		toolTipContent: "<b>{x}</b><br><span style=\"color:#4F81BC\">{name}</span>: <br>Mở: {y[0]}<br>Cao: {y[1]}<br>Thấp: {y[2]}<br>Đóng: {y[3]}<br><b>Đóng cửa điều chỉnh</b>: {y[4]}",
		dataPoints: [
			{ x: new Date(2016, 00), y: [214.000000, 221.000000, 200.470001, 211.000000, 202.457352] },
			{ x: new Date(2016, 01), y: [209.259995, 220.139999, 203.649994, 215.789993, 207.053421] },
			{ x: new Date(2016, 02), y: [216.589996, 223.860001, 210.899994, 221.500000, 214.138062] },
			{ x: new Date(2016, 03), y: [219.960007, 234.589996, 219.169998, 232.380005, 224.656464] },
			{ x: new Date(2016, 04), y: [232.740005, 245.369995, 231.369995, 236.229996, 228.378494] },
			{ x: new Date(2016, 05), y: [236.229996, 248.720001, 234.750000, 248.169998, 241.571869] },
			{ x: new Date(2016, 06), y: [248.169998, 263.369995, 247.880005, 252.729996, 246.010620] },
			{ x: new Date(2016, 07), y: [252.630005, 266.929993, 238.600006, 242.970001, 236.510101] },
			{ x: new Date(2016, 08), y: [243.130005, 247.479996, 235.279999, 239.720001, 234.933273] },
			{ x: new Date(2016, 09), y: [238.710007, 252.000000, 228.500000, 246.380005, 241.460281] },
			{ x: new Date(2016, 10), y: [247.190002, 269.739990, 236.210007, 265.250000, 259.953491] },
			{ x: new Date(2016, 11), y: [265.290009, 269.899994, 245.500000, 249.940002, 246.637146] }
		]
	},
	{
		type: "line",
		axisYType: "secondary",
		markerSize: 6,
		name: "Khối lượng giao dịch",
		showInLegend: true,
		dataPoints: [
			{ x: new Date(2016, 00), y: 40421200 },
			{ x: new Date(2016, 01), y: 32717100 },
			{ x: new Date(2016, 02), y: 24930400 },
			{ x: new Date(2016, 03), y: 21628500 },
			{ x: new Date(2016, 04), y: 23070900 },
			{ x: new Date(2016, 05), y: 28267100 },
			{ x: new Date(2016, 06), y: 54446800 },
			{ x: new Date(2016, 07), y: 146232200 },
			{ x: new Date(2016, 08), y: 30222100 },
			{ x: new Date(2016, 09), y: 28914900 },
			{ x: new Date(2016, 10), y: 32666300 },
			{ x: new Date(2016, 11), y: 34840600 }
		]
	}]
});
chart.render();

function addSymbols(e){
	var suffixes = ["", "K", "M", "B"];
	var order = Math.max(Math.floor(Math.log(Math.abs(e.value)) / Math.log(1000)), 0);

	if(order > suffixes.length - 1)
		order = suffixes.length - 1;

	var suffix = suffixes[order];
	return CanvasJS.formatNumber(e.value / Math.pow(1000, order)) + suffix;
}

function toggleDataSeries(e) {
	if (typeof (e.dataSeries.visible) === "undefined" || e.dataSeries.visible) {
		e.dataSeries.visible = false;
	} else {
		e.dataSeries.visible = true;
	}
	e.chart.render();
}

}
</script>
</head>
<body>
<div id="chartContainer" style="height: 300px; width: 100%;"></div>
<script src="https://cdn.canvasjs.com/canvasjs.min.js"></script>
</body>
</html>Nguồn: CanvasJS
Tùy biến biểu đồ
Giống như các mẫu biểu đồ khác được tạo bằng JavaScript, bạn cũng có thể thay đổi thuộc tính trong code nguồn để có kết quả như ý muốn. Ví dụ:
visible: Hiện/ẩn chuỗi dữ liệulineColor: Tùy biến màu sắc của đườnglineThickness: Độ dày của đườngcolor: Màu sắcmarkerType: Kiểu đánh dấu- …
Bạn nên đọc
-

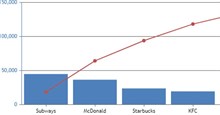
Code JavaScript tạo biểu đồ & đồ thị Pareto
-
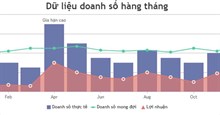
Code JavaScript tạo biểu đồ/đồ thị kết hợp đường, vùng và cột
-
Code JavaScript tạo biểu đồ/đồ thị động
-
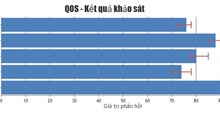
Code biểu đồ/đồ thị thanh kết hợp sai số
-
Code JavaScript tạo mẫu biểu đồ Pareto với nhãn Index/Data
-
Tổng hợp bài tập JavaScript có code mẫu
-
Code JavaScript tạo biểu đồ đa chuỗi update dữ liệu trực tiếp
-
Code JavaScript tạo biểu đồ kết hợp giữa vùng và đường
-
JavaScript là gì?


Theo Nghị định 147/2024/ND-CP, bạn cần xác thực tài khoản trước khi sử dụng tính năng này. Chúng tôi sẽ gửi mã xác thực qua SMS hoặc Zalo tới số điện thoại mà bạn nhập dưới đây:
 Hướng dẫn AI
 Ứng dụng
 Hệ thống
 Game - Trò chơi
 iPhone
 Android
 Làng Công nghệ
 Hàm Excel
 Cuộc sống
 Khoa học