 AI
AI
 ChatGPT
 Gemini
 Thư viện Prompt
 Công nghệ
 Học IT
 Tiện ích
Code JavaScript tạo biểu đồ đường/tuyến với trục thang đo logarit

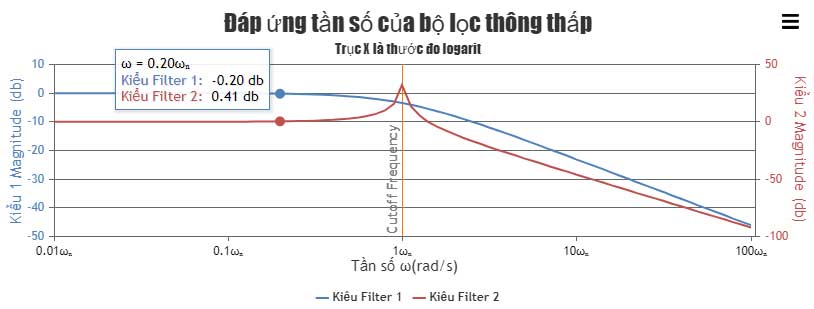
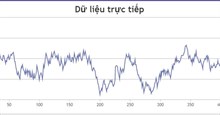
Biểu đồ đường/tuyến hỗ trợ thang đo logarit cho cả hai trục X và Y. Chúng thực sự hữu ích khi vẽ các giá trị khoa học hoặc toán học. Bạn cũng có thể chọn cơ số logarit cho các trục khác nhau.
Ví dụ bên dưới cho biết phản hồi tần số của bộ lọc thông thấp (low pass) bằng Line Chart với trục logarit dọc trục X. Nó cũng chứa mã nguồn JavaScript cho bạn chỉnh sửa trong trình duyệt hoặc lưu về máy chạy nội bộ.
<!DOCTYPE HTML>
<html>
<head>
<script>
window.onload = function () {

var step = Math.pow(10, .05);
var chart = new CanvasJS.Chart("chartContainer", {
	zoomEnabled: true,
	zoomType: "xy",
	exportEnabled: true,
	title: {
		text: "Đáp ứng tần số của bộ lọc thông thấp"
	},
	subtitles:[{
		text: "Trục X là thước đo logarit",
		fontSize: 14
	}],
	axisX: {
		logarithmic: true,
		title: "Tần số \u03C9(rad/s)",
		minimum: .01,
		suffix: "\u03C9\u2099",
		stripLines: [{
			value: 1,
			label: "Cutoff Frequency",
			labelFontColor: "#808080",
			labelAlign: "near"
		}]
	},
	axisY: {
		title: "Kiểu 1 Magnitude (db)",
		titleFontColor: "#4F81BC",
		labelFontColor: "#4F81BC"
	},
	axisY2: {
		title: "Kiểu 2 Magnitude (db)",
		titleFontColor: "#C0504E",
		labelFontColor: "#C0504E"
	},
	toolTip: {
		shared: true
	},
	legend:{
		cursor:"pointer",
		itemclick: toogleDataSeries
	},
	data: [{
		type: "line",
		name: "Kiểu Filter 1",
		showInLegend: true,
		yValueFormatString: "#,##0.00 db",
		xValueFormatString: "\u03C9 = #,##0.00#\u03C9\u2099",
		dataPoints: type1DataPoints(step)
	},
	{
		type: "line",
		name: "Kiểu Filter 2",
		color: "#C0504E",
		showInLegend: true,
		axisYType: "secondary",
		yValueFormatString: "#,##0.00 db",
		xValueFormatString: "\u03C9 = #,##0.00#\u03C9\u2099",
		dataPoints: type2DataPoints(.02, step)
	}]
});

chart.render();

function type1DataPoints(step){
	var dataPoints = [];
	var h;
	for(var w = .01; w < 100 ; w *= step){
		h =  -5 * Math.log(w*w + 1);
		dataPoints.push({x: w, y: h});
	}
	return dataPoints
}

function type2DataPoints(e, step){
	var dataPoints = [];
	var h;
	for(var w = .01; w < 100 ; w *= step){
		h =  -5 * Math.log(Math.pow((1 - w*w), 2) + 4 *e*e*w*w);
		dataPoints.push({x: w, y: h});
	}
	return dataPoints;
}

function toogleDataSeries(e){
	if (typeof(e.dataSeries.visible) === "undefined" || e.dataSeries.visible) {
		e.dataSeries.visible = false;
	} else{
		e.dataSeries.visible = true;
	}
	chart.render();
}

}
</script>
</head>
<body>
<div id="chartContainer" style="height: 300px; width: 100%;"></div>
<script src="https://canvasjs.com/assets/script/canvasjs.min.js"></script>
</body>
</html>
Nguồn: CanvasJS
Tùy biến biểu đồ
Bạn có thể thiết lập trục logarit bằng cách đặt thuộc tính logarithmic sang true. Bạn cũng có thể đặt cơ số của logarit bằng thuộc tính logarithmBase.
Những tùy biến khác bao gồm:
lineThickness- Độ dày đường.lineColor- Màu sắc đường.zoomEnabled- Cho phép thu phóng.- …
Bạn nên đọc
-

JavaScript là gì?
-
Code JavaScript tạo biểu đồ/đồ thị động
-
Code JavaScript tạo mẫu biểu đồ đường nhiều chuỗi
-
Code JavaScript tạo mẫu biểu đồ kết hợp OHLC và biểu đồ đường
-
Code JavaScript tạo biểu đồ đường với Zoom và Pan
-
Tổng hợp bài tập JavaScript có code mẫu
-
Code JavaScript tạo biểu đồ/đồ thị đường dạng động
-
Cách tạo công cụ đếm từ trong JavaScript
-
Code JavaScript tạo biểu đồ đường với các dấu dữ liệu hoặc đường


Theo Nghị định 147/2024/ND-CP, bạn cần xác thực tài khoản trước khi sử dụng tính năng này. Chúng tôi sẽ gửi mã xác thực qua SMS hoặc Zalo tới số điện thoại mà bạn nhập dưới đây:
 Hướng dẫn AI
 Ứng dụng
 Hệ thống
 Game - Trò chơi
 iPhone
 Android
 Làng Công nghệ
 Hàm Excel
 Cuộc sống
 Khoa học