 AI
AI
 ChatGPT
 Gemini
 Thư viện Prompt
 Công nghệ
 Học IT
 Tiện ích
Code JavaScript tạo biểu đồ vùng Spline đa chuỗi dữ liệu

Mua gói Thành viên Pro để trải nghiệm không quảng cáo và sử dụng các tiện ích AI
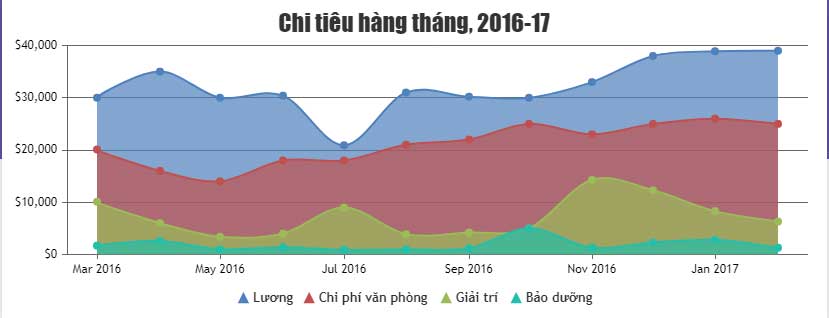
CanvasJS cho phép bạn thêm nhiều hơn một chuỗi dữ liệu để tạo biểu đồ vùng dạng Spline đa chuỗi. Việc so sánh hai hoặc nhiều tập hợp dữ liệu trong biểu đồ đa chuỗi này dễ hơn các đồ thị khác.
Ví dụ bên dưới hiển thị biểu đồ spline nhiều chuỗi được tạo bằng JavaScript. Bài viết cũng cung cấp mã nguồn cho bạn chỉnh sửa trong trình duyệt hoặc lưu về máy để chạy nội bộ.
<!DOCTYPE HTML>
<html>
<head>
<script>
window.onload = function () {

var chart = new CanvasJS.Chart("chartContainer", {
	animationEnabled: true,
	title:{
		text: "Chi tiêu hàng tháng, 2016-17"
	},
	axisY :{
		includeZero: false,
		prefix: "$"
	},
	toolTip: {
		shared: true
	},
	legend: {
		fontSize: 13
	},
	data: [{
		type: "splineArea",
		showInLegend: true,
		name: "Lương",
		yValueFormatString: "$#,##0",
		xValueFormatString: "MMM YYYY",
		dataPoints: [
			{ x: new Date(2016, 2), y: 30000 },
			{ x: new Date(2016, 3), y: 35000 },
			{ x: new Date(2016, 4), y: 30000 },
			{ x: new Date(2016, 5), y: 30400 },
			{ x: new Date(2016, 6), y: 20900 },
			{ x: new Date(2016, 7), y: 31000 },
			{ x: new Date(2016, 8), y: 30200 },
			{ x: new Date(2016, 9), y: 30000 },
			{ x: new Date(2016, 10), y: 33000 },
			{ x: new Date(2016, 11), y: 38000 },
			{ x: new Date(2017, 0),  y: 38900 },
			{ x: new Date(2017, 1),  y: 39000 }
		]
 	},
	{
		type: "splineArea",
		showInLegend: true,
		name: "Chi phí văn phòng",
		yValueFormatString: "$#,##0",
		dataPoints: [
			{ x: new Date(2016, 2), y: 20100 },
			{ x: new Date(2016, 3), y: 16000 },
			{ x: new Date(2016, 4), y: 14000 },
			{ x: new Date(2016, 5), y: 18000 },
			{ x: new Date(2016, 6), y: 18000 },
			{ x: new Date(2016, 7), y: 21000 },
			{ x: new Date(2016, 8), y: 22000 },
			{ x: new Date(2016, 9), y: 25000 },
			{ x: new Date(2016, 10), y: 23000 },
			{ x: new Date(2016, 11), y: 25000 },
			{ x: new Date(2017, 0), y: 26000 },
			{ x: new Date(2017, 1), y: 25000 }
		]
 	},
	{
		type: "splineArea",
		showInLegend: true,
		name: "Giải trí",
		yValueFormatString: "$#,##0",
		dataPoints: [
			{ x: new Date(2016, 2), y: 10100 },
			{ x: new Date(2016, 3), y: 6000 },
			{ x: new Date(2016, 4), y: 3400 },
			{ x: new Date(2016, 5), y: 4000 },
			{ x: new Date(2016, 6), y: 9000 },
			{ x: new Date(2016, 7), y: 3900 },
			{ x: new Date(2016, 8), y: 4200 },
			{ x: new Date(2016, 9), y: 5000 },
			{ x: new Date(2016, 10), y: 14300 },
			{ x: new Date(2016, 11), y: 12300 },
			{ x: new Date(2017, 0), y: 8300 },
			{ x: new Date(2017, 1), y: 6300 }
		]
 	},
	{
		type: "splineArea",
		showInLegend: true,
		yValueFormatString: "$#,##0",
		name: "Bảo dưỡng",
		dataPoints: [
			{ x: new Date(2016, 2), y: 1700 },
			{ x: new Date(2016, 3), y: 2600 },
			{ x: new Date(2016, 4), y: 1000 },
			{ x: new Date(2016, 5), y: 1400 },
			{ x: new Date(2016, 6), y: 900 },
			{ x: new Date(2016, 7), y: 1000 },
			{ x: new Date(2016, 8), y: 1200 },
			{ x: new Date(2016, 9), y: 5000 },
			{ x: new Date(2016, 10), y: 1300 },
			{ x: new Date(2016, 11), y: 2300 },
			{ x: new Date(2017, 0), y: 2800 },
			{ x: new Date(2017, 1), y: 1300 }
		]
	}]
});
chart.render();

}
</script>
</head>
<body>
<div id="chartContainer" style="height: 300px; width: 100%;"></div>
<script type="text/javascript" src="https://canvasjs.com/assets/script/canvasjs.min.js"></script>
</body>
</html>
Nguồn: CanvasJS
Tùy biến biểu đồ
Dưới đây là một số thuộc tính mà bạn có thể thay đổi để chỉnh sửa biểu đồ/đồ thị như ý muốn.
showInLegend kích hoạt chú giải.
Color tô màu cho vùng được lấp đầy
lineColor là màu đường kẻ trình bày dữ liệu
Shared (tooltip) - bộ công cụ được chia sẻ
legendMarkerColor - Màu sắc đánh dấu chú giải
legendMarkerType - Kiểu đánh dấu chú giải
Bạn nên đọc


Theo Nghị định 147/2024/ND-CP, bạn cần xác thực tài khoản trước khi sử dụng tính năng này. Chúng tôi sẽ gửi mã xác thực qua SMS hoặc Zalo tới số điện thoại mà bạn nhập dưới đây:
 Hướng dẫn AI
 Ứng dụng
 Hệ thống
 Game - Trò chơi
 iPhone
 Android
 Làng Công nghệ
 Hàm Excel
 Cuộc sống
 Khoa học