 AI
AI
 ChatGPT
 Gemini
 Thư viện Prompt
 Công nghệ
 Học IT
 Tiện ích

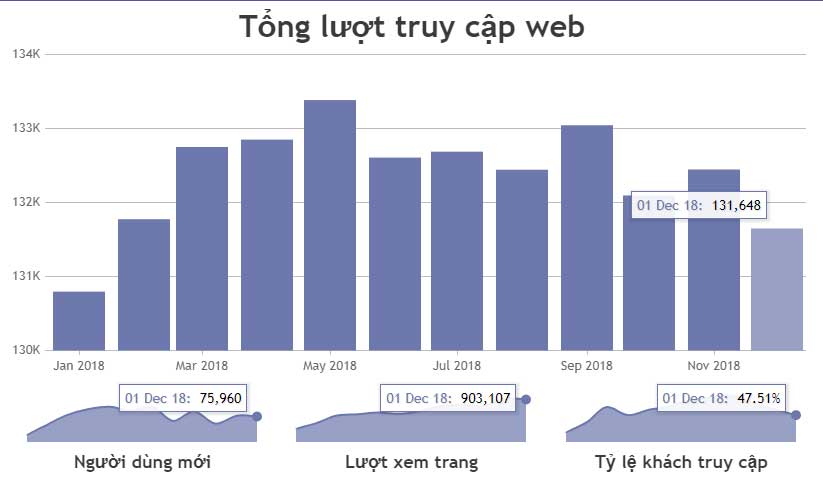
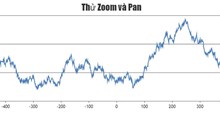
Mẫu biểu đồ Syncing Tooltip cho phép bạn phân tích các tham số liên quan trên nhiều biểu đồ trong một trang. Thư viện trên CanvasJS cung cấp API để giúp bạn làm mẫu tương tự.
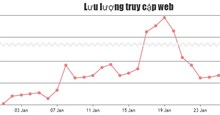
Dưới đây là code mẫu JavaScript tạo biểu đồ dữ liệu phân tích web với tooltip được đồng bộ trên các biểu đồ/đồ thị.
<!DOCTYPE HTML>
<html>
<head>
<script>
window.onload = function () {
  var charts = [];
  var axisX = {
    labelFormatter: function(){ return "";},
    tickLength: 0,
    lineThickness: 0
  },
  axisY = {
    labelFormatter: function(){ return "";},
    tickLength: 0,
    gridThickness: 0,
  };

  var newUserOptions = {
    animationEnabled: true,
    theme: "light2",
    title:{
      text: "Người dùng mới",
      fontSize: 18,
      verticalAlign: "bottom"
    },
    axisX: axisX,
    axisY: axisY,
    data: [{
      type: "splineArea", //thay đổi kiểu sang bar, line, area, pie, etc
      markerSize: 0,
      dataPoints: [
        { x: new Date(2018, 00, 01), y: 74553 },
        { x: new Date(2018, 01, 01), y: 75374 },
        { x: new Date(2018, 02, 01), y: 76065 },
        { x: new Date(2018, 03, 01), y: 76521 },
        { x: new Date(2018, 04, 01), y: 76695 },
        { x: new Date(2018, 05, 01), y: 76381 },
        { x: new Date(2018, 06, 01), y: 76693 },
        { x: new Date(2018, 07, 01), y: 75624 },
        { x: new Date(2018, 08, 01), y: 76367 },
        { x: new Date(2018, 09, 01), y: 75426 },
        { x: new Date(2018, 10, 01), y: 76024 },
        { x: new Date(2018, 11, 01), y: 75960 }
      ]
    }]
  }
  var bounceRateOptions = {
    animationEnabled: true,
    theme: "light2",
    title:{
      text: "Tỷ lệ khách truy cập",
      fontSize: 18,
      verticalAlign: "bottom"
    },
    axisX: axisX,
    axisY: axisY,
    data: [{
      type: "splineArea", //thay đổi sang bar, line, area, pie, etc
      markerSize: 0,
      yValueFormatString: "#.##%",
      dataPoints: [
        { x: new Date(2018, 00, 01), y: 0.4731 },
        { x: new Date(2018, 01, 01), y: 0.4743 },
        { x: new Date(2018, 02, 01), y: 0.4760 },
        { x: new Date(2018, 03, 01), y: 0.4751 },
        { x: new Date(2018, 04, 01), y: 0.4757 },
        { x: new Date(2018, 05, 01), y: 0.4761 },
        { x: new Date(2018, 06, 01), y: 0.4768 },
        { x: new Date(2018, 07, 01), y: 0.4771 },
        { x: new Date(2018, 08, 01), y: 0.4773 },
        { x: new Date(2018, 09, 01), y: 0.4764 },
        { x: new Date(2018, 10, 01), y: 0.4757 },
        { x: new Date(2018, 11, 01), y: 0.4751 }
      ]
    }]
  }

  var pageViewsOptions = {
    animationEnabled: true,
    theme: "light2",
    title:{
      text: "Lượt xem trang",
      fontSize: 18,
      verticalAlign: "bottom"
    },
    axisX: axisX,
    axisY: axisY,
    data: [{
      type: "splineArea", //thay đổi sang bar, line, area, pie, etc
      markerSize: 0,
      dataPoints: [
        { x: new Date(2018, 00, 01), y: 897533 },
        { x: new Date(2018, 01, 01), y: 898699 },
        { x: new Date(2018, 02, 01), y: 900047 },
        { x: new Date(2018, 03, 01), y: 900348 },
        { x: new Date(2018, 04, 01), y: 900678 },
        { x: new Date(2018, 05, 01), y: 900407 },
        { x: new Date(2018, 06, 01), y: 900946 },
        { x: new Date(2018, 07, 01), y: 901937 },
        { x: new Date(2018, 08, 01), y: 902117 },
        { x: new Date(2018, 09, 01), y: 901936 },
        { x: new Date(2018, 10, 01), y: 903288 },
        { x: new Date(2018, 11, 01), y: 903107 }
      ]
    }]
  }

  var visitorsOptions = {
    animationEnabled: true,
    theme: "light2", // "light1", "light2", "dark1", "dark2"
    title:{
      text: "Tổng lượt truy cập web"
    },
    axisY: {
      labelFormatter: addSymbols
    },
    data: [{
      type: "column", //thay đổi sang bar, line, area, pie, etc
      color: "#6D78AD",
      dataPoints: [
        { x: new Date(2018, 00, 01), y: 130796 },
        { x: new Date(2018, 01, 01), y: 131774 },
        { x: new Date(2018, 02, 01), y: 132750 },
        { x: new Date(2018, 03, 01), y: 132850 },
        { x: new Date(2018, 04, 01), y: 133384 },
        { x: new Date(2018, 05, 01), y: 132607 },
        { x: new Date(2018, 06, 01), y: 132687 },
        { x: new Date(2018, 07, 01), y: 132443 },
        { x: new Date(2018, 08, 01), y: 133044 },
        { x: new Date(2018, 09, 01), y: 132095 },
        { x: new Date(2018, 10, 01), y: 132446 },
        { x: new Date(2018, 11, 01), y: 131648 }
      ]
    }]
  };

  charts.push(new CanvasJS.Chart("chartContainer1", visitorsOptions));
  charts.push(new CanvasJS.Chart("chartContainer2", newUserOptions));
  charts.push(new CanvasJS.Chart("chartContainer3", pageViewsOptions));
  charts.push(new CanvasJS.Chart("chartContainer4", bounceRateOptions));
  syncTooltip(charts);

  for( var i = 0; i < charts.length; i++){
    charts[i].render();
  }

  function syncTooltip(charts) {

    if(!this.onToolTipUpdated){
      this.onToolTipUpdated = function(e) {
        for (var j = 0; j < charts.length; j++) {
          if (charts[j] != e.chart)
            charts[j].toolTip.showAtX(e.entries[0].xValue);
        }
      }
    }

    if(!this.onToolTipHidden){
      this.onToolTipHidden = function(e) {
        for( var j = 0; j < charts.length; j++){
          if(charts[j] != e.chart)
            charts[j].toolTip.hide();
        }
      }
    }

    for(var i = 0; i < charts.length; i++) {
        if(!charts[i].options.toolTip)
          charts[i].options.toolTip = {};

        charts[i].options.toolTip.updated = this.onToolTipUpdated;
        charts[i].options.toolTip.hidden = this.onToolTipHidden;
    }
  }

  function addSymbols(e){
      var suffixes = ["", "K", "M", "B"];

      var order = Math.max(Math.floor(Math.log(Math.abs(e.value)) / Math.log(1000)), 0);
      if(order > suffixes.length - 1)
          order = suffixes.length - 1;

      var suffix = suffixes[order];
      return CanvasJS.formatNumber(e.value / Math.pow(1000, order)) + suffix;
  }
}
</script>
<style>
  .row:after {
    content: "";
    display: table;
    clear: both;
  }
  .col {
    float: left;
    width: 33.33%;
    height: 100px;
  }
</style>
</head>
<body>
<div id="chartContainer1" style="height: 370px; width: 100%;"></div>
<div class="row">
  <div class="col" id="chartContainer2"></div>
  <div class="col" id="chartContainer3"></div>
  <div class="col" id="chartContainer4"></div>
</div>
<script src="https://canvasjs.com/assets/script/canvasjs.min.js"></script>
</body>
</html>Nguồn: CanvasJS
Tùy biến biểu đồ/đồ thị
Bạn cũng có thể đồng bộ phạm vi trục trên nhiều biểu đồ trong khi thu phóng/xoay bằng event rangeChanging và rangeChanged.
Tag: JavaScript, code JavaScript, code biểu đồ JavaScript, mẫu biểu đồ JavaScript, mẫu biểu đồ đồng bộ tooltip JavaScript, lập trình JavaScript


 Hướng dẫn AI
 Ứng dụng
 Hệ thống
 Game - Trò chơi
 iPhone
 Android
 Làng Công nghệ
 Hàm Excel
 Cuộc sống
 Khoa học