 AI
AI
 ChatGPT
 Gemini
 Thư viện Prompt
 Công nghệ
 Học IT
 Tiện ích

Bài viết hôm nay sẽ tiến hành xếp hạng tất cả các card đồ họa thế hệ trước và hiện tại theo hiệu suất, bao gồm tất cả các card đồ họa tốt nhất, theo nguồn dữ liệu từ trang Tom's Hardware. Quá trình kiểm tra GPU đã được cải tiến và cập nhật tất cả các điểm benchmark cho năm 2026 cho GPU AMD RDNA 2 và Nvidia Ampere thế hệ hiện tại, dòng Turing và RDNA, cũng như nhiều thế hệ khác.
Các bảng sau đây chỉ sắp xếp mọi thứ theo điểm benchmark chơi game GPU dựa trên hiệu suất, không bao gồm giá cả, mức tiêu thụ điện năng của card đồ họa, hiệu suất tổng thể và các tính năng khác.
Xếp hạng benchmark GPU 2022

| Card đồ họa | 1080p Ultra | 1080p Medium | 1440p Ultra | 4K Ultra |
|---|---|---|---|---|
| GeForce RTX 3090 Ti GA102, 10752 shader, 1860MHz, 24GB GDDR6X@21Gbps, 1008GB/s, 450W |
100.0% (132.4fps) | 100.0% (180.1fps) | 100.0% (113.9fps) | 100.0% (75.7fps) |
| Radeon RX 6900 XT Navi 21, 5120 shader, 2250MHz, 16GB GDDR6@16Gbps, 512GB/s, 300W |
98.6% (130.6fps) | 103.4% (186.2fps) | 94.0% (107.0fps) | 83.1% (62.9fps) |
| GeForce RTX 3090 GA102, 10496 shader, 1695MHz, 24GB GDDR6X@19.5Gbps, 936GB/s, 350W |
95.6% (126.6fps) | 98.9% (178.1fps) | 93.6% (106.5fps) | 90.9% (68.8fps) |
| GeForce RTX 3080 12GB GA102, 8960 shader, 1845MHz, 12GB GDDR6X@19Gbps, 912GB/s, 400W |
94.0% (124.5fps) | 99.0% (178.2fps) | 91.3% (104.0fps) | 87.6% (66.3fps) |
| Radeon RX 6800 XT Navi 21, 4608 shader, 2250MHz, 16GB GDDR6@16Gbps, 512GB/s, 300W |
94.0% (124.5fps) | 100.3% (180.7fps) | 88.9% (101.2fps) | 77.3% (58.5fps) |
| GeForce RTX 3080 Ti GA102, 10240 shader, 1665MHz, 12GB GDDR6X@19Gbps, 912GB/s, 350W |
93.2% (123.4fps) | 97.1% (174.9fps) | 90.8% (103.4fps) | 87.8% (66.5fps) |
| GeForce RTX 3080 GA102, 8704 shader, 1710MHz, 10GB GDDR6X@19Gbps, 760GB/s, 320W |
87.8% (116.3fps) | 96.3% (173.4fps) | 83.9% (95.5fps) | 80.1% (60.6fps) |
| Radeon RX 6800 Navi 21, 3840 shader, 2105MHz, 16GB GDDR6@16Gbps, 512GB/s, 250W |
84.3% (111.7fps) | 96.8% (174.3fps) | 76.9% (87.5fps) | 66.7% (50.5fps) |
| GeForce RTX 3070 Ti GA104, 6144 shader, 1770MHz, 8GB GDDR6X@19Gbps, 608GB/s, 290W |
78.6% (104.1fps) | 90.2% (162.4fps) | 72.5% (82.6fps) | 61.9% (46.8fps) |
| Titan RTX TU102, 4608 shader, 1770MHz, 24GB GDDR6@14Gbps, 672GB/s, 280W |
75.6% (100.1fps) | 87.9% (158.2fps) | 70.7% (80.5fps) | 63.8% (48.3fps) |
| GeForce RTX 3070 GA104, 5888 shader, 1725MHz, 8GB GDDR6@14Gbps, 448GB/s, 220W |
75.3% (99.8fps) | 87.5% (157.7fps) | 68.0% (77.5fps) | 57.0% (43.2fps) |
| Radeon RX 6700 XT Navi 22, 2560 shader, 2581MHz, 12GB GDDR6@16Gbps, 384GB/s, 230W |
72.5% (96.0fps) | 88.7% (159.8fps) | 61.9% (70.4fps) | 50.9% (38.5fps) |
| GeForce RTX 2080 Ti TU102, 4352 shader, 1545MHz, 11GB GDDR6@14Gbps, 616GB/s, 250W |
72.5% (96.0fps) | 84.2% (151.6fps) | 66.1% (75.3fps) | 58.9% (44.6fps) |
| GeForce RTX 3060 Ti GA104, 4864 shader, 1665MHz, 8GB GDDR6@14Gbps, 448GB/s, 200W |
69.1% (91.5fps) | 83.1% (149.7fps) | 61.2% (69.7fps) | |
| GeForce RTX 2080 Super TU104, 3072 shader, 1815MHz, 8GB GDDR6@15.5Gbps, 496GB/s, 250W |
64.1% (84.9fps) | 76.5% (137.8fps) | 57.0% (64.9fps) | 45.6% (34.5fps) |
| GeForce RTX 2080 TU104, 2944 shader, 1710MHz, 8GB GDDR6@14Gbps, 448GB/s, 215W |
62.1% (82.2fps) | 73.9% (133.1fps) | 54.8% (62.4fps) | |
| Radeon RX 6600 XT Navi 23, 2048 shader, 2589MHz, 8GB GDDR6@16Gbps, 256GB/s, 160W |
59.1% (78.2fps) | 76.0% (136.8fps) | 48.2% (54.9fps) | |
| GeForce RTX 2070 Super TU104, 2560 shader, 1770MHz, 8GB GDDR6@14Gbps, 448GB/s, 215W |
57.7% (76.4fps) | 68.9% (124.1fps) | 50.4% (57.4fps) | |
| Radeon RX 5700 XT Navi 10, 2560 shader, 1905MHz, 8GB GDDR6@14Gbps, 448GB/s, 225W |
55.7% (73.7fps) | 69.9% (125.8fps) | 46.8% (53.3fps) | 38.6% (29.3fps) |
| GeForce RTX 3060 GA106, 3584 shader, 1777MHz, 12GB GDDR6@15Gbps, 360GB/s, 170W |
53.0% (70.2fps) | 66.0% (118.8fps) | 46.2% (52.6fps) | |
| Radeon VII Vega 20, 3840 shader, 1750MHz, 16GB HBM2@2.0Gbps, 1024GB/s, 300W |
52.6% (69.7fps) | 63.3% (114.0fps) | 46.5% (53.0fps) | 41.5% (31.4fps) |
| GeForce RTX 2070 TU106, 2304 shader, 1620MHz, 8GB GDDR6@14Gbps, 448GB/s, 175W |
51.3% (67.9fps) | 61.5% (110.7fps) | 44.8% (51.0fps) | |
| Radeon RX 6600 Navi 23, 1792 shader, 2491MHz, 8GB GDDR6@14Gbps, 224GB/s, 132W |
50.4% (66.7fps) | 65.4% (117.8fps) | 40.5% (46.1fps) | |
| GeForce GTX 1080 Ti GP102, 3584 shader, 1582MHz, 11GB GDDR5X@11Gbps, 484GB/s, 250W |
50.3% (66.5fps) | 61.4% (110.6fps) | 44.1% (50.3fps) | 39.0% (29.5fps) |
| GeForce RTX 2060 Super TU106, 2176 shader, 1650MHz, 8GB GDDR6@14Gbps, 448GB/s, 175W |
49.1% (65.1fps) | 58.8% (105.9fps) | 42.4% (48.2fps) | |
| Radeon RX 5700 Navi 10, 2304 shader, 1725MHz, 8GB GDDR6@14Gbps, 448GB/s, 180W |
49.0% (64.8fps) | 61.8% (111.3fps) | 41.4% (47.2fps) | |
| Radeon RX 5600 XT Navi 10, 2304 shader, 1750MHz, 8GB GDDR6@14Gbps, 336GB/s, 160W |
43.9% (58.1fps) | 55.8% (100.6fps) | 36.9% (42.0fps) | |
| Radeon RX Vega 64 Vega 10, 4096 shader, 1546MHz, 8GB HBM2@1.89Gbps, 484GB/s, 295W |
42.9% (56.8fps) | 52.4% (94.3fps) | 36.5% (41.6fps) | 31.0% (23.5fps) |
| GeForce RTX 2060 TU106, 1920 shader, 1680MHz, 6GB GDDR6@14Gbps, 336GB/s, 160W |
41.7% (55.2fps) | 53.8% (96.8fps) | 34.0% (38.7fps) | |
| GeForce GTX 1080 GP104, 2560 shader, 1733MHz, 8GB GDDR5X@10Gbps, 320GB/s, 180W |
40.1% (53.1fps) | 50.0% (90.0fps) | 34.6% (39.4fps) | |
| GeForce RTX 3050 GA106, 2560 shader, 1777MHz, 8GB GDDR6@14Gbps, 224GB/s, 130W |
38.8% (51.4fps) | 49.6% (89.4fps) | 33.0% (37.6fps) | |
| GeForce GTX 1070 Ti GP104, 2432 shader, 1683MHz, 8GB GDDR5@8Gbps, 256GB/s, 180W |
38.6% (51.1fps) | 47.6% (85.8fps) | 33.3% (37.9fps) | |
| Radeon RX Vega 56 Vega 10, 3584 shader, 1471MHz, 8GB HBM2@1.6Gbps, 410GB/s, 210W |
38.2% (50.6fps) | 46.9% (84.4fps) | 32.5% (37.0fps) | |
| GeForce GTX 1070 GP104, 1920 shader, 1683MHz, 8GB GDDR5@8Gbps, 256GB/s, 150W |
33.8% (44.8fps) | 35.5% (64.0fps) | 34.1% (38.8fps) | |
| GeForce GTX 1660 Super TU116, 1408 shader, 1785MHz, 6GB GDDR6@14Gbps, 336GB/s, 125W |
33.6% (44.4fps) | 46.0% (82.8fps) | 27.6% (31.5fps) | |
| GeForce GTX 1660 Ti TU116, 1536 shader, 1770MHz, 6GB GDDR6@12Gbps, 288GB/s, 120W |
33.1% (43.9fps) | 45.4% (81.9fps) | 27.7% (31.6fps) | |
| GeForce GTX 1660 TU116, 1408 shader, 1785MHz, 6GB GDDR5@8Gbps, 192GB/s, 120W |
30.1% (39.9fps) | 41.7% (75.1fps) | 25.0% (28.5fps) | |
| Radeon RX 5500 XT 8GB Navi 14, 1408 shader, 1845MHz, 8GB GDDR6@14Gbps, 224GB/s, 130W |
30.1% (39.8fps) | 40.3% (72.6fps) | 25.0% (28.5fps) | |
| Radeon RX 590 Polaris 30, 2304 shader, 1545MHz, 8GB GDDR5@8Gbps, 256GB/s, 225W |
29.7% (39.4fps) | 38.1% (68.6fps) | 25.5% (29.1fps) | |
| GeForce GTX 980 Ti GM200, 2816 shader, 1075MHz, 6GB GDDR5@7Gbps, 336GB/s, 250W |
27.1% (35.9fps) | 34.7% (62.6fps) | 23.4% (26.7fps) | |
| Radeon R9 Fury X Fiji, 4096 shader, 1050MHz, 4GB HBM2@2Gbps, 512GB/s, 275W |
26.7% (35.4fps) | 35.8% (64.4fps) | ||
| Radeon RX 580 8GB Polaris 20, 2304 shader, 1340MHz, 8GB GDDR5@8Gbps, 256GB/s, 185W |
26.7% (35.3fps) | 34.3% (61.7fps) | 22.8% (26.0fps) | |
| Radeon RX 5500 XT 4GB Navi 14, 1408 shader, 1845MHz, 4GB GDDR6@14Gbps, 224GB/s, 130W |
25.3% (33.5fps) | 37.2% (66.9fps) | ||
| GeForce GTX 1650 Super TU116, 1280 shader, 1725MHz, 4GB GDDR6@12Gbps, 192GB/s, 100W |
25.1% (33.2fps) | 37.7% (67.9fps) | 20.2% (23.0fps) | |
| GeForce GTX 1060 6GB GP106, 1280 shader, 1708MHz, 6GB GDDR5@8Gbps, 192GB/s, 120W |
24.3% (32.2fps) | 32.2% (58.0fps) | 20.2% (23.0fps) | |
| Radeon RX 6500 XT Navi 24, 1024 shader, 2815MHz, 4GB GDDR6@18Gbps, 144GB/s, 107W |
23.0% (30.4fps) | 36.3% (65.4fps) | 15.8% (18.0fps) | |
| Radeon R9 390 Grenada, 2560 shader, 1000MHz, 8GB GDDR5@6Gbps, 384GB/s, 275W |
22.5% (29.8fps) | 28.4% (51.2fps) | ||
| GeForce GTX 980 GM204, 2048 shader, 1216MHz, 4GB GDDR5@7Gbps, 256GB/s, 165W |
21.8% (28.9fps) | 29.8% (53.7fps) | ||
| Radeon RX 570 4GB Polaris 20, 2048 shader, 1244MHz, 4GB GDDR5@7Gbps, 224GB/s, 150W |
21.4% (28.3fps) | 29.8% (53.6fps) | 17.5% (20.0fps) | |
| GeForce GTX 1060 3GB * GP106, 1152 shader, 1708MHz, 3GB GDDR5@8Gbps, 192GB/s, 120W |
21.0% (27.8fps) | 29.2% (52.6fps) | ||
| GeForce GTX 1650 TU117, 896 shader, 1665MHz, 4GB GDDR5@8Gbps, 128GB/s, 75W |
20.1% (26.6fps) | 28.4% (51.1fps) | ||
| GeForce GTX 970 GM204, 1664 shader, 1178MHz, 4GB GDDR5@7Gbps, 256GB/s, 145W |
20.0% (26.5fps) | 27.3% (49.1fps) | ||
| GeForce GTX 780 * GK110, 2304 shader, 900MHz, 3GB GDDR5@6Gbps, 288GB/s, 230W |
16.6% (22.0fps) | 21.4% (38.5fps) | ||
| GeForce GTX 1050 Ti GP107, 768 shader, 1392MHz, 4GB GDDR5@7Gbps, 112GB/s, 75W |
15.0% (19.8fps) | 21.1% (38.0fps) | ||
| GeForce GTX 1050 * GP107, 640 shader, 1455MHz, 2GB GDDR5@7Gbps, 112GB/s, 75W |
11.2% (14.8fps) | 16.5% (29.8fps) | ||
| Radeon RX 560 4GB Baffin, 1024 shader, 1275MHz, 4GB GDDR5@7Gbps, 112GB/s, 60-80W |
11.2% (14.8fps) | 17.7% (31.8fps) | ||
| Radeon RX 550 4GB Lexa, 640 shader, 1183MHz, 4GB GDDR5@7Gbps, 112GB/s, 50W |
Không được thử nghiệm | 10.9% (19.6fps) |
Xếp hạng benchmark GPU về hiệu suất Ray Tracing 2022
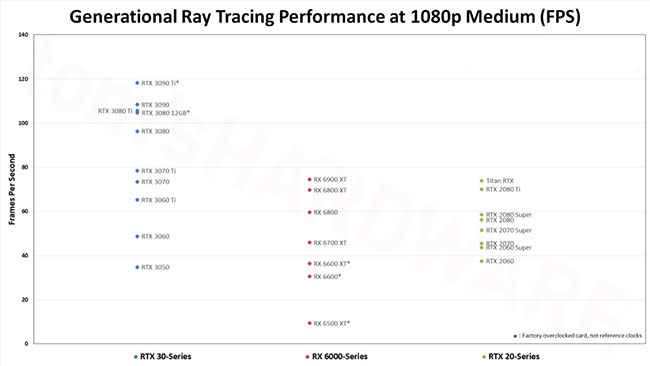
| Card đồ họa | 1080p Medium | 1080p Ultra | 1440p Ultra | 4K Ultra |
|---|---|---|---|---|
| GeForce RTX 3090 Ti GA102, 10752 shader, 1860MHz, 24GB GDDR6X@21Gbps, 1008GB/s, 450W |
100.0% (118.2fps) | 100.0% (84.4fps) | 100.0% (57.2fps) | 100.0% (29.1fps) |
| GeForce RTX 3090 GA102, 10496 shader, 1695MHz, 24GB GDDR6X@19.5Gbps, 936GB/s, 350W |
91.7% (108.4fps) | 89.7% (75.7fps) | 88.7% (50.8fps) | 87.2% (25.4fps) |
| GeForce RTX 3080 Ti GA102, 10240 shader, 1665MHz, 12GB GDDR6X@19Gbps, 912GB/s, 350W |
89.3% (105.6fps) | 87.6% (73.9fps) | 86.0% (49.2fps) | 84.6% (24.7fps) |
| GeForce RTX 3080 12GB GA102, 8960 shader, 1845MHz, 12GB GDDR6X@19Gbps, 912GB/s, 400W |
88.5% (104.7fps) | 85.8% (72.4fps) | 83.7% (47.9fps) | 81.4% (23.7fps) |
| GeForce RTX 3080 GA102, 8704 shader, 1710MHz, 10GB GDDR6X@19Gbps, 760GB/s, 320W |
81.5% (96.3fps) | 78.5% (66.3fps) | 76.3% (43.7fps) | 72.2% (21.0fps) |
| GeForce RTX 3070 Ti GA104, 6144 shader, 1770MHz, 8GB GDDR6X@19Gbps, 608GB/s, 290W |
66.3% (78.4fps) | 63.0% (53.1fps) | 59.2% (33.9fps) | |
| Radeon RX 6900 XT Navi 21, 5120 shader, 2250MHz, 16GB GDDR6@16Gbps, 512GB/s, 300W |
63.0% (74.5fps) | 59.0% (49.8fps) | 55.2% (31.6fps) | 51.7% (15.1fps) |
| Titan RTX TU102, 4608 shader, 1770MHz, 24GB GDDR6@14Gbps, 672GB/s, 280W |
62.5% (73.9fps) | 58.2% (49.1fps) | 55.4% (31.7fps) | 52.5% (15.3fps) |
| GeForce RTX 3070 GA104, 5888 shader, 1725MHz, 8GB GDDR6@14Gbps, 448GB/s, 220W |
62.1% (73.4fps) | 58.7% (49.6fps) | 54.9% (31.4fps) | |
| GeForce RTX 2080 Ti TU102, 4352 shader, 1545MHz, 11GB GDDR6@14Gbps, 616GB/s, 250W |
59.2% (70.0fps) | 55.1% (46.5fps) | 52.0% (29.7fps) | |
| Radeon RX 6800 XT Navi 21, 4608 shader, 2250MHz, 16GB GDDR6@16Gbps, 512GB/s, 300W |
59.0% (69.7fps) | 54.6% (46.1fps) | 51.3% (29.4fps) | 48.2% (14.0fps) |
| GeForce RTX 3060 Ti GA104, 4864 shader, 1665MHz, 8GB GDDR6@14Gbps, 448GB/s, 200W |
55.2% (65.3fps) | 51.3% (43.3fps) | 47.8% (27.4fps) | |
| Radeon RX 6800 Navi 21, 3840 shader, 2105MHz, 16GB GDDR6@16Gbps, 512GB/s, 250W |
50.4% (59.6fps) | 46.6% (39.3fps) | 43.6% (24.9fps) | |
| GeForce RTX 2080 Super TU104, 3072 shader, 1815MHz, 8GB GDDR6@15.5Gbps, 496GB/s, 250W |
49.6% (58.6fps) | 45.0% (37.9fps) | 41.6% (23.8fps) | |
| GeForce RTX 2080 TU104, 2944 shader, 1710MHz, 8GB GDDR6@14Gbps, 448GB/s, 215W |
47.5% (56.2fps) | 42.5% (35.9fps) | 39.1% (22.4fps) | |
| GeForce RTX 2070 Super TU104, 2560 shader, 1770MHz, 8GB GDDR6@14Gbps, 448GB/s, 215W |
43.6% (51.5fps) | 39.2% (33.1fps) | 35.5% (20.3fps) | |
| GeForce RTX 3060 GA106, 3584 shader, 1777MHz, 12GB GDDR6@15Gbps, 360GB/s, 170W |
41.2% (48.7fps) | 38.3% (32.3fps) | 35.1% (20.1fps) | |
| Radeon RX 6700 XT Navi 22, 2560 shader, 2581MHz, 12GB GDDR6@16Gbps, 384GB/s, 230W |
38.8% (45.9fps) | 36.1% (30.5fps) | 32.6% (18.7fps) | |
| GeForce RTX 2070 TU106, 2304 shader, 1620MHz, 8GB GDDR6@14Gbps, 448GB/s, 175W |
38.5% (45.5fps) | 34.9% (29.4fps) | 31.6% (18.1fps) | |
| GeForce RTX 2060 Super TU106, 2176 shader, 1650MHz, 8GB GDDR6@14Gbps, 448GB/s, 175W |
36.9% (43.6fps) | 33.0% (27.9fps) | 29.9% (17.1fps) | |
| GeForce RTX 2060 TU106, 1920 shader, 1680MHz, 6GB GDDR6@14Gbps, 336GB/s, 160W |
31.8% (37.6fps) | 26.7% (22.5fps) | ||
| Radeon RX 6600 XT Navi 23, 2048 shader, 2589MHz, 8GB GDDR6@16Gbps, 256GB/s, 160W |
30.8% (36.4fps) | 28.0% (23.6fps) | ||
| GeForce RTX 3050 GA106, 2560 shader, 1777MHz, 8GB GDDR6@14Gbps, 224GB/s, 130W |
29.4% (34.8fps) | 27.0% (22.8fps) | ||
| Radeon RX 6600 Navi 23, 1792 shader, 2491MHz, 8GB GDDR6@14Gbps, 224GB/s, 132W |
25.8% (30.5fps) | 23.3% (19.6fps) | ||
| Radeon RX 6500 XT Navi 24, 1024 shader, 2815MHz, 4GB GDDR6@18Gbps, 144GB/s, 107W |
7.9% (9.4fps) |
Cấu hình PC mới nhất năm 2022 sử dụng nền tảng và CPU Alder Lake. Đây là thông tin chi tiết về PC được thử nghiệm.
- Intel Core i9-12900K
- MSI Pro Z690-A WiFi DDR4
- Corsair 2x16GB DDR4-3600 CL16
- Crucial P5 Plus 2TB
- Cooler Master MWE 1250 V2 Gold
- Cooler Master PL360 Flux
- Cooler Master HAF500
- Windows 11 Pro 64-bit
Xem thêm:


 Làng Công nghệ
 Chuyện công nghệ
 Hướng dẫn AI
 Ứng dụng
 Hệ thống
 Game - Trò chơi
 iPhone
 Android
 Hàm Excel
 Cuộc sống
 Khoa học