 Công nghệ
  Windows
  iPhone
  Android
  Học CNTT
  Download
  Tiện ích
  Khoa học
  Game
Game  Làng CN
  Ứng dụng
 Code JavaScript tạo biểu đồ đường với nhiều trục

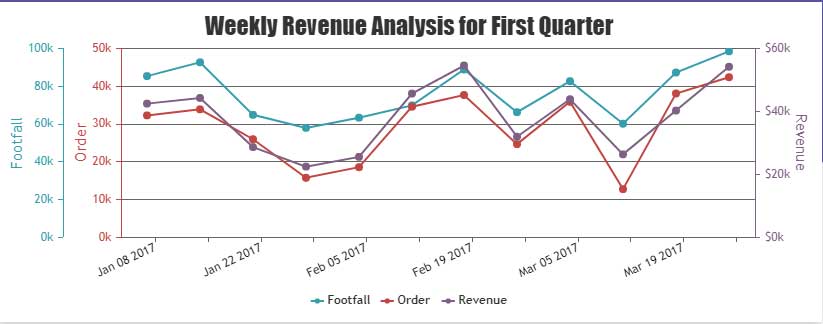
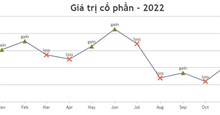
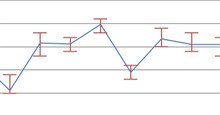
Mẫu biểu đồ đường/tuyến được tạo bằng JavaScript dưới đây hỗ trợ vẽ hai hoặc nhiều thước đo. Tính năng này thực sự hữu ích khi trình bày các giá trị trong một biểu đồ có nhiều biến động dữ liệu.
Code mẫu JavaScript trong Canvas JS dưới đây hỗ trợ tạo tất cả đồ thị/biểu đồ kèm trục. Ví dụ này cho bạn thấy biểu đồ đường sử dụng nhiều trục Y để biểu thị các tỷ lệ khác nhau.
Bài viết cũng cung cấp mã nguồn cho bạn chỉnh sửa code JavaScript tạo biểu đồ bên dưới trong trình duyệt hoặc lưu về máy để chạy nội bộ.
<!DOCTYPE HTML>
<html>
<head>
<script>
window.onload = function () {
	var chart = new CanvasJS.Chart("chartContainer", {
	title:{
		text: "Weekly Revenue Analysis for First Quarter"
	},
	axisY:[{
		title: "Order",
		lineColor: "#C24642",
		tickColor: "#C24642",
		labelFontColor: "#C24642",
		titleFontColor: "#C24642",
		includeZero: true,
		suffix: "k"
	},
	{
		title: "Footfall",
		lineColor: "#369EAD",
		tickColor: "#369EAD",
		labelFontColor: "#369EAD",
		titleFontColor: "#369EAD",
		includeZero: true,
		suffix: "k"
	}],
	axisY2: {
		title: "Revenue",
		lineColor: "#7F6084",
		tickColor: "#7F6084",
		labelFontColor: "#7F6084",
		titleFontColor: "#7F6084",
		includeZero: true,
		prefix: "$",
		suffix: "k"
	},
	toolTip: {
		shared: true
	},
	legend: {
		cursor: "pointer",
		itemclick: toggleDataSeries
	},
	data: [{
		type: "line",
		name: "Footfall",
		color: "#369EAD",
		showInLegend: true,
		axisYIndex: 1,
		dataPoints: [
			{ x: new Date(2017, 00, 7), y: 85.4 },
			{ x: new Date(2017, 00, 14), y: 92.7 },
			{ x: new Date(2017, 00, 21), y: 64.9 },
			{ x: new Date(2017, 00, 28), y: 58.0 },
			{ x: new Date(2017, 01, 4), y: 63.4 },
			{ x: new Date(2017, 01, 11), y: 69.9 },
			{ x: new Date(2017, 01, 18), y: 88.9 },
			{ x: new Date(2017, 01, 25), y: 66.3 },
			{ x: new Date(2017, 02, 4), y: 82.7 },
			{ x: new Date(2017, 02, 11), y: 60.2 },
			{ x: new Date(2017, 02, 18), y: 87.3 },
			{ x: new Date(2017, 02, 25), y: 98.5 }
		]
	},
	{
		type: "line",
		name: "Order",
		color: "#C24642",
		axisYIndex: 0,
		showInLegend: true,
		dataPoints: [
			{ x: new Date(2017, 00, 7), y: 32.3 },
			{ x: new Date(2017, 00, 14), y: 33.9 },
			{ x: new Date(2017, 00, 21), y: 26.0 },
			{ x: new Date(2017, 00, 28), y: 15.8 },
			{ x: new Date(2017, 01, 4), y: 18.6 },
			{ x: new Date(2017, 01, 11), y: 34.6 },
			{ x: new Date(2017, 01, 18), y: 37.7 },
			{ x: new Date(2017, 01, 25), y: 24.7 },
			{ x: new Date(2017, 02, 4), y: 35.9 },
			{ x: new Date(2017, 02, 11), y: 12.8 },
			{ x: new Date(2017, 02, 18), y: 38.1 },
			{ x: new Date(2017, 02, 25), y: 42.4 }
		]
	},
	{
		type: "line",
		name: "Revenue",
		color: "#7F6084",
		axisYType: "secondary",
		showInLegend: true,
		dataPoints: [
			{ x: new Date(2017, 00, 7), y: 42.5 },
			{ x: new Date(2017, 00, 14), y: 44.3 },
			{ x: new Date(2017, 00, 21), y: 28.7 },
			{ x: new Date(2017, 00, 28), y: 22.5 },
			{ x: new Date(2017, 01, 4), y: 25.6 },
			{ x: new Date(2017, 01, 11), y: 45.7 },
			{ x: new Date(2017, 01, 18), y: 54.6 },
			{ x: new Date(2017, 01, 25), y: 32.0 },
			{ x: new Date(2017, 02, 4), y: 43.9 },
			{ x: new Date(2017, 02, 11), y: 26.4 },
			{ x: new Date(2017, 02, 18), y: 40.3 },
			{ x: new Date(2017, 02, 25), y: 54.2 }
		]
	}]
});
chart.render();

function toggleDataSeries(e) {
	if (typeof (e.dataSeries.visible) === "undefined" || e.dataSeries.visible) {
		e.dataSeries.visible = false;
	} else {
		e.dataSeries.visible = true;
	}
	e.chart.render();
}

}
</script>
</head>
<body>
<div id="chartContainer" style="height: 300px; width: 100%;"></div>
<script src="https://canvasjs.com/assets/script/canvasjs.min.js"></script>
</body>
</html>
Nguồn: CanvasJS
Tùy biến biểu đồ đường nhiều trục
Bạn có thể đính kèm chuỗi dữ liệu vào trục thứ hai bằng cách dùng thuộc tính axisXType / axisYType.
Bạn cũng có thể chọn chỉ mục của trục cho từng chuỗi dữ liệu dùng axisXIndex và axisYIndex. Các lựa chọn tùy chỉnh thường dùng khác là: shared - chia sẻ, showInLegend - hiện trong chú giải…
Bạn nên đọc
-

Code JavaScript tạo biểu đồ đường có điểm ngắt trục
-
Code mẫu JavaScript đồng bộ tooltip trên nhiều biểu đồ/đồ thị
-
Code JavaScript tạo biểu đồ đường/tuyến với trục thang đo logarit
-
Code JavaScript tạo biểu đồ/đồ thị đường dạng động
-
Code JavaScript tạo biểu đồ đường với các dấu dữ liệu hoặc đường
-
Code JavaScript tạo biểu đồ đường với Zoom và Pan

Có thể bạn quan tâm

- Công nghệ
- Học CNTT
- Quiz công nghệ
- Microsoft Word 2016
- Microsoft Word 2013
- Microsoft Word 2007
- Microsoft Excel 2019
- Microsoft Excel 2016
- Hàm Excel
- Microsoft PowerPoint 2019
- Microsoft PowerPoint 2016
- Google Sheets - Trang tính
- Code mẫu
- Photoshop CS6
- Photoshop CS5
- Lập trình Scratch
- HTML
- Học Python
- CSS và CSS3
- Học SQL
- Lập trình C
- Lập trình C++
- Lập trình C#
- Học HTTP
- Bootstrap
- SQL Server
- JavaScript
- Học PHP
- jQuery
- Học MongoDB
- Unix/Linux
- Học Git
- NodeJS
-
- Download
- Tiện ích
- Khoa học
- Điện máy
- Cuộc sống
- Video
- Ô tô, Xe máy
- Làng Công nghệ
 Linux
Linux  Đồng hồ thông minh
  Chụp ảnh - Quay phim
  macOS
macOS  Phần cứng
  Thủ thuật SEO
  Kiến thức cơ bản
  Dịch vụ ngân hàng
  Lập trình
  Dịch vụ nhà mạng
  Dịch vụ công trực tuyến
  Nhà thông minh
  Quiz công nghệ
  Microsoft Word 2016
  Microsoft Word 2013
  Microsoft Word 2007
  Microsoft Excel 2019
  Microsoft Excel 2016
  Google Sheets - Trang tính
  Code mẫu
  Photoshop CS6
  Photoshop CS5
  Bootstrap
  Ứng dụng văn phòng
  Tải game
  Tiện ích hệ thống
  Ảnh, đồ họa
  Internet
  Bảo mật, Antivirus
  Họp, học trực tuyến
  Video, phim, nhạc
  Giao tiếp, liên lạc, hẹn hò
  Hỗ trợ học tập
  Máy ảo
  Điện máy
  Tủ lạnh
  Tivi
Tivi  Điều hòa
  Máy giặt
  Quạt các loại
  Cuộc sống
  Kỹ năng
  Món ngon mỗi ngày
  Làm đẹp
  Nuôi dạy con
  Chăm sóc Nhà cửa
  Du lịch
  Halloween
  Mẹo vặt
  Giáng sinh - Noel
  Quà tặng
  Giải trí
  Là gì?
  Nhà đẹp
  TOP
TOP  Ô tô, Xe máy
  Giấy phép lái xe
  Tấn công mạng
  Chuyện công nghệ
  Công nghệ mới
  Trí tuệ nhân tạo (AI)
  Anh tài công nghệ
  Bình luận công nghệ